Understanding the Collection Rates Over Time Dashboard
The following information applies to both the Common Pleas Court and Magisterial District Court versions of this dashboard.
This dashboard displays the amount of money assessed by the courts in a specified year and calculates the rate of payment over subsequent years.
Five separate measurement methods are used to display statistical results within this dashboard: |
Assessments & Payments (table) |
Displays a series of totals that indicate the extent to which the courts have been able to collect monies on all the court-ordered payments (assessments) levied in a specific disposition year. No monies associated to bail or escrow are included in these totals and any total within parentheses () represents a negative number. There are four statistical categories:
● Total Court-Ordered Payments – The sum of all costs/fees, fines, and restitution levied on cases disposed in the selected disposition year and in any subsequent period where assessments were created, adjusted, or cancelled and applied retroactively to the selected disposition year. Adjustments are often made in instances where the defendant has died, the court ruled that a defendant is indigent and not required to pay, a defendant is released from court-ordered supervision and their outstanding assessments were decreased, or court-ordered supervision was extended and a defendant's assessments were increased. ● Payments Made – The amount of money paid to date on the court-ordered payments levied in the selected disposition year. ● Payments Owed – The amount of all court-ordered payments that remain unpaid for the selected disposition year. This is calculated by subtracting 'Payments Made' from 'Total Court-Ordered Payments'. ● Payment Percentage – Indicates how much, per each court-ordered dollar assessed in the selected disposition year, has been paid to date. For example, if the payment percentage for a given disposition year is 45.93%, this indicates that roughly 46 cents has been paid for every dollar assessed that year.
|
Collection Rate by County (map) |
The map of Pennsylvania offers a more illustrative way of portraying the collection rate for each county. Various shades of green are used to reflect this rate for the corresponding disposition year. Lighter shades represent a smaller collection rate and darker shades represent counties with higher rate totals. Hovering your mouse pointer over any county displays an informational popup that provides the county name, its county number, and its county class. In addition, this popup displays the county's precise collection rate and the total sum collected for the disposition year.
The shaded counties that appear in the map are based on the selections in the Select a County and Select a County Class filters at the top of the screen. For example, if the dashboard is restricted to Allegheny County through the Select a County filter, only an image of that county is displayed on the map. Alternatively, selecting ‘3’ from the Select a County Class filter places a focus on the counties within that class by removing the green shading from all counties outside that class.
|
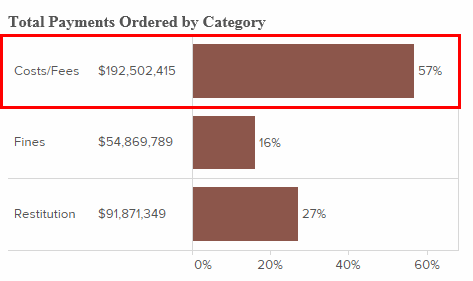
Total Payments Ordered by Category (bar graph) |
This graph classifies the court-ordered payments levied for the selected disposition year into the three assessment categories: costs/fees, fines, and restitution. The percentages displayed represent the portion of all assessment dollars that fall into each category.
|
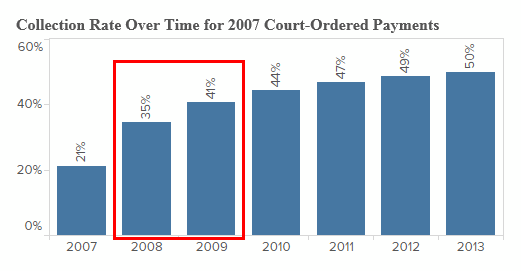
Collection Rate Over Time for Court-Ordered Payments (bar graph) |
This graph shows the year-by-year payment growth for the selected disposition year. Each percentage represents how much of each court-ordered dollar assessed in the selected disposition year was paid by the end of the corresponding calendar year.
|
Collection Rate of All Court-Ordered Payments by Category (table) |
Based on all the payments that have been collected for the selected disposition year, this table shows the percent of each dollar that has been applied to all costs/fees, fines, and restitution over several years. Within each assessment category, these percentages are cumulative from one year to the next.
|


