Understanding the Money Collected For Fees, Fines, Costs and Restitution Dashboard
The following information applies to both the Common Pleas Court and Magisterial District Court versions of this dashboard.
This dashboard displays the disbursement of monies collected by the courts to state/local governments and other public entities.
Five separate measurement methods are used to display statistical results within this dashboard: |
Annual Disbursement of Fees, Fines, Costs, and Restitution Collected by Courts (bar graph) |
Displays the amount of money that was distributed by the courts over several years, per state and county law, to state and local governments/agencies, private restitution (includes individuals and insurance agencies), and other public entities. The amount disbursed is based on the total payments receipted that year, on the court-ordered assessments levied in any year, and excludes all monies associated to refunds and vouchers. These amounts are not cumulative from one year to the next. The gray line that runs across this graph represents the average yearly disbursement amount for all years displayed.
|
Total Disbursements of Court Fees, Fines, Costs, and Restitution by County (map) |
The map of Pennsylvania offers a more illustrative way of portraying disbursement totals for each county over a specific time period. Various shades of green are used to reflect these totals. Lighter shades represent smaller disbursement totals and darker shades represent counties with higher totals. Hovering your mouse pointer over any county displays an informational popup that provides the county name, its county number, and its county class. In addition, this popup displays the county's precise disbursement total.
The shaded counties that appear in the map are based on the selections in the Select a County and Select a County Class filters at the top of the screen. For example, if the dashboard is restricted to Allegheny County through the Select a County filter, only an image of that county is displayed on the map. Alternatively, selecting ‘3’ from the Select a County Class filter places a focus on the counties within that class by removing the green shading from all counties outside that class.
|
Annual Disbursement of Court Collections by Recipient (table) |
Displays the amount disbursed by the courts, over several calendar years, to the Commonwealth (state), counties, municipalities (cities, townships, or boroughs), and private restitution. An additional category, Other, shows disbursements to other public institutions such as schools, libraries, tax agencies, etc. Disbursements, depending upon the costs/fees and fines assessed, are allocated to each of these entities by state or local law.
|
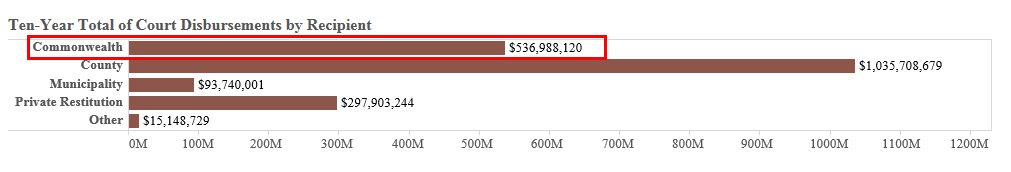
Ten-year Total of Court Disbursements by Recipient (bar graph) |
Based on the total disbursement amount over the last ten calendar years, this bar graph represents the amounts applicable to each recipient category.
|
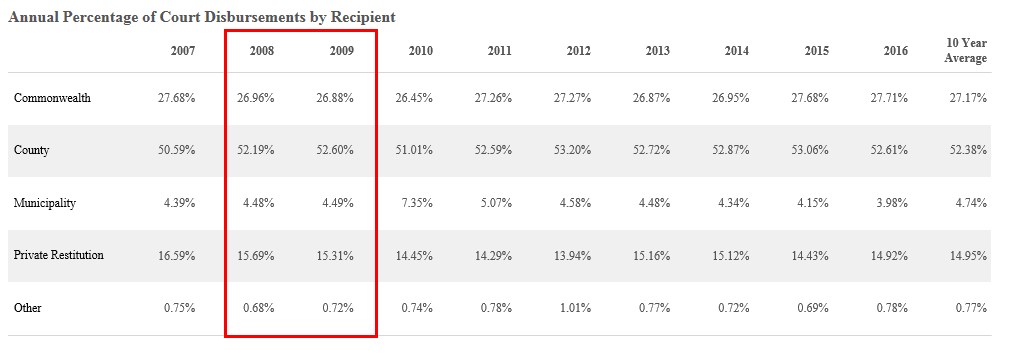
Annual Percentage of Court Disbursements by Recipient (table) |
Based on the disbursement amounts for several individual years, this table displays those amounts in each recipient category as a percentage of the total dollars disbursed that year. The percentages displayed are not cumulative from year to year.
|