
News
Back to school: Traffic citations in school zones

News Article
September 09, 2019
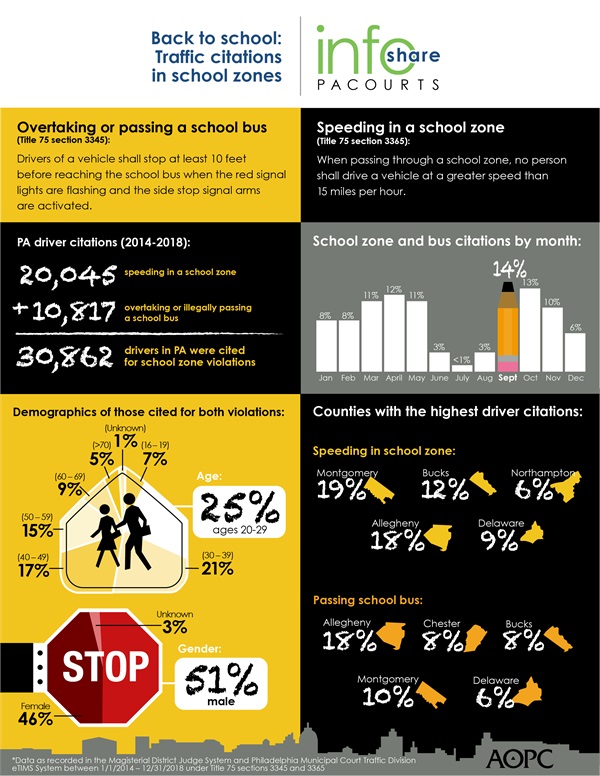
September is the heaviest month for school zone violations. Over the last five years, 30,862 Pennsylvania drivers were cited with school zone violations for either speeding in school zones or illegally passing a school bus.
The infographic below highlights key data and demographics about traffic citations in school zones in Pennsylvania over the last five years. Download a high-resolution version of the graphic. County-level detail provided at the end of the release.
PA Courts InfoShare is a monthly product of the Administrative Office of Pennsylvania Courts (AOPC) that visually highlights the work of the courts with interesting data and statistics obtained through the judiciary’s case management systems, interactive dashboards and other research. Reproduction is permissible with source cited.
##
Media contact: Kimberly Bathgate, 717-231-3331
Editor’s note:
| Title 75 School Zone violations issued from 1/1/2014 through 12/31/2018 as recorded in the Magisterial District Judge System (MDJS) and Philadelphia Municipal Court Traffic Division eTIMS System.; County Composition | |||||||
| Section / Offense Description | Filed Year | Total | % of Overall | ||||
| 2014 | 2015 | 2016 | 2017 | 2018 | |||
| 3345 / Meeting/Overtaking School Bus | 1,985 | 2,221 | 2,034 | 2,292 | 2,285 | 10,817 | N/A |
| Adams | 15 | 17 | 14 | 31 | 4 | 81 | 0.75% |
| Allegheny | 389 | 374 | 286 | 453 | 433 | 1,935 | 17.89% |
| Armstrong | 12 | 19 | 16 | 4 | 8 | 59 | 0.55% |
| Beaver | 10 | 27 | 25 | 28 | 15 | 105 | 0.97% |
| Bedford | 4 | 4 | 6 | 0 | 3 | 17 | 0.16% |
| Berks | 70 | 50 | 96 | 149 | 122 | 487 | 4.50% |
| Blair | 2 | 14 | 25 | 14 | 5 | 60 | 0.55% |
| Bradford | 11 | 11 | 7 | 1 | 7 | 37 | 0.34% |
| Bucks | 144 | 164 | 146 | 200 | 169 | 823 | 7.61% |
| Butler | 58 | 89 | 90 | 38 | 64 | 339 | 3.13% |
| Cambria | 19 | 18 | 16 | 21 | 17 | 91 | 0.84% |
| Cameron | 0 | 0 | 0 | 2 | 0 | 2 | 0.02% |
| Carbon | 3 | 3 | 15 | 10 | 6 | 37 | 0.34% |
| Centre | 17 | 21 | 35 | 50 | 31 | 154 | 1.42% |
| Chester | 206 | 164 | 157 | 161 | 155 | 843 | 7.79% |
| Clarion | 4 | 1 | 8 | 7 | 7 | 27 | 0.25% |
| Clearfield | 5 | 3 | 9 | 3 | 7 | 27 | 0.25% |
| Clinton | 1 | 0 | 4 | 2 | 2 | 9 | 0.08% |
| Columbia | 4 | 7 | 18 | 13 | 14 | 56 | 0.52% |
| Crawford | 13 | 14 | 4 | 9 | 9 | 49 | 0.45% |
| Cumberland | 28 | 39 | 28 | 26 | 30 | 151 | 1.40% |
| Dauphin | 62 | 107 | 67 | 86 | 63 | 385 | 3.56% |
| Delaware | 113 | 158 | 133 | 119 | 125 | 648 | 5.99% |
| Elk | 2 | 2 | 0 | 1 | 3 | 8 | 0.07% |
| Erie | 81 | 69 | 41 | 42 | 49 | 282 | 2.61% |
| Fayette | 6 | 2 | 6 | 11 | 5 | 30 | 0.28% |
| Franklin | 17 | 17 | 7 | 9 | 7 | 57 | 0.53% |
| Fulton | 1 | 5 | 2 | 1 | 4 | 13 | 0.12% |
| Greene | 2 | 7 | 1 | 4 | 0 | 14 | 0.13% |
| Huntingdon | 5 | 3 | 1 | 2 | 2 | 13 | 0.12% |
| Indiana | 3 | 11 | 8 | 3 | 5 | 30 | 0.28% |
| Jefferson | 3 | 18 | 11 | 7 | 5 | 44 | 0.41% |
| Juniata | 1 | 3 | 0 | 2 | 2 | 8 | 0.07% |
| Lackawanna | 19 | 24 | 28 | 44 | 39 | 154 | 1.42% |
| Lancaster | 52 | 50 | 51 | 60 | 75 | 288 | 2.66% |
| Lawrence | 7 | 8 | 8 | 4 | 9 | 36 | 0.33% |
| Lebanon | 6 | 4 | 9 | 12 | 6 | 37 | 0.34% |
| Lehigh | 41 | 85 | 58 | 70 | 60 | 314 | 2.90% |
| Luzerne | 21 | 24 | 30 | 18 | 36 | 129 | 1.19% |
| Lycoming | 21 | 9 | 15 | 12 | 7 | 64 | 0.59% |
| McKean | 3 | 3 | 4 | 2 | 4 | 16 | 0.15% |
| Mercer | 2 | 28 | 18 | 14 | 9 | 71 | 0.66% |
| Mifflin | 3 | 3 | 3 | 7 | 9 | 25 | 0.23% |
| Monroe | 14 | 19 | 19 | 18 | 12 | 82 | 0.76% |
| Montgomery | 178 | 204 | 173 | 219 | 334 | 1,108 | 10.24% |
| Montour | 3 | 1 | 1 | 0 | 0 | 5 | 0.05% |
| Northampton | 50 | 66 | 54 | 52 | 34 | 256 | 2.37% |
| Northumberland | 14 | 6 | 5 | 5 | 11 | 41 | 0.38% |
| Perry | 7 | 5 | 3 | 6 | 3 | 24 | 0.22% |
| Philadelphia | 71 | 73 | 82 | 71 | 64 | 361 | 3.34% |
| Pike | 1 | 8 | 7 | 4 | 2 | 22 | 0.20% |
| Potter | 3 | 2 | 0 | 0 | 2 | 7 | 0.06% |
| Schuylkill | 10 | 18 | 8 | 29 | 14 | 79 | 0.73% |
| Snyder | 5 | 4 | 2 | 1 | 2 | 14 | 0.13% |
| Somerset | 5 | 1 | 3 | 4 | 1 | 14 | 0.13% |
| Sullivan | 0 | 0 | 1 | 2 | 0 | 3 | 0.03% |
| Susquehanna | 5 | 1 | 5 | 3 | 3 | 17 | 0.16% |
| Tioga | 0 | 4 | 4 | 1 | 1 | 10 | 0.09% |
| Union | 0 | 2 | 1 | 1 | 3 | 7 | 0.06% |
| Venango | 9 | 3 | 6 | 11 | 15 | 44 | 0.41% |
| Warren | 2 | 1 | 5 | 2 | 1 | 11 | 0.10% |
| Washington | 23 | 34 | 24 | 25 | 25 | 131 | 1.21% |
| Wayne | 0 | 3 | 8 | 3 | 0 | 14 | 0.13% |
| Westmoreland | 38 | 22 | 34 | 21 | 36 | 151 | 1.40% |
| Wyoming | 1 | 0 | 6 | 9 | 4 | 20 | 0.18% |
| York | 60 | 65 | 77 | 53 | 86 | 341 | 3.15% |
| 3365 / Speeding In School Zone | 4,493 | 4,400 | 3,964 | 3,653 | 3,535 | 20,045 | N/A |
| Adams | 65 | 113 | 61 | 76 | 52 | 367 | 1.83% |
| Allegheny | 919 | 907 | 653 | 714 | 453 | 3,646 | 18.19% |
| Armstrong | 5 | 3 | 6 | 1 | 2 | 17 | 0.08% |
| Beaver | 80 | 215 | 160 | 74 | 54 | 583 | 2.91% |
| Bedford | 1 | 0 | 0 | 1 | 2 | 4 | 0.02% |
| Berks | 231 | 174 | 142 | 114 | 119 | 780 | 3.89% |
| Blair | 96 | 3 | 112 | 22 | 17 | 250 | 1.25% |
| Bradford | 7 | 1 | 3 | 0 | 0 | 11 | 0.05% |
| Bucks | 425 | 490 | 616 | 440 | 508 | 2,479 | 12.37% |
| Butler | 14 | 20 | 40 | 35 | 28 | 137 | 0.68% |
| Cambria | 18 | 30 | 16 | 16 | 16 | 96 | 0.48% |
| Cameron | 0 | 0 | 0 | 0 | 1 | 1 | 0.00% |
| Carbon | 8 | 14 | 5 | 2 | 15 | 44 | 0.22% |
| Centre | 14 | 3 | 3 | 7 | 7 | 34 | 0.17% |
| Chester | 121 | 120 | 146 | 149 | 174 | 710 | 3.54% |
| Clarion | 4 | 1 | 1 | 6 | 1 | 13 | 0.06% |
| Clearfield | 21 | 29 | 0 | 1 | 2 | 53 | 0.26% |
| Clinton | 13 | 16 | 6 | 17 | 0 | 52 | 0.26% |
| Columbia | 0 | 0 | 0 | 0 | 1 | 1 | 0.00% |
| Crawford | 3 | 4 | 12 | 16 | 26 | 61 | 0.30% |
| Cumberland | 144 | 60 | 63 | 32 | 38 | 337 | 1.68% |
| Dauphin | 130 | 59 | 83 | 39 | 23 | 334 | 1.67% |
| Delaware | 397 | 510 | 308 | 271 | 231 | 1,717 | 8.57% |
| Elk | 6 | 6 | 5 | 6 | 6 | 29 | 0.14% |
| Erie | 60 | 67 | 47 | 65 | 90 | 329 | 1.64% |
| Fayette | 1 | 5 | 2 | 4 | 0 | 12 | 0.06% |
| Franklin | 6 | 13 | 12 | 13 | 22 | 66 | 0.33% |
| Fulton | 2 | 7 | 0 | 1 | 2 | 12 | 0.06% |
| Greene | 12 | 7 | 4 | 9 | 1 | 33 | 0.16% |
| Huntingdon | 0 | 2 | 3 | 0 | 0 | 5 | 0.02% |
| Indiana | 17 | 6 | 1 | 3 | 7 | 34 | 0.17% |
| Jefferson | 7 | 6 | 0 | 0 | 1 | 14 | 0.07% |
| Juniata | 3 | 4 | 2 | 0 | 0 | 9 | 0.04% |
| Lackawanna | 18 | 8 | 13 | 11 | 19 | 69 | 0.34% |
| Lancaster | 23 | 7 | 33 | 17 | 12 | 92 | 0.46% |
| Lawrence | 3 | 6 | 1 | 12 | 3 | 25 | 0.12% |
| Lebanon | 57 | 32 | 28 | 28 | 17 | 162 | 0.81% |
| Lehigh | 103 | 82 | 109 | 32 | 22 | 348 | 1.74% |
| Luzerne | 13 | 28 | 61 | 35 | 76 | 213 | 1.06% |
| Lycoming | 0 | 0 | 2 | 19 | 20 | 41 | 0.20% |
| McKean | 1 | 0 | 0 | 0 | 2 | 3 | 0.01% |
| Mercer | 18 | 20 | 19 | 6 | 40 | 103 | 0.51% |
| Mifflin | 1 | 0 | 0 | 0 | 0 | 1 | 0.00% |
| Monroe | 3 | 1 | 2 | 0 | 0 | 6 | 0.03% |
| Montgomery | 687 | 705 | 621 | 791 | 1,013 | 3,817 | 19.04% |
| Montour | 2 | 0 | 0 | 1 | 0 | 3 | 0.01% |
| Northampton | 348 | 287 | 199 | 247 | 192 | 1,273 | 6.35% |
| Northumberland | 5 | 23 | 19 | 6 | 3 | 56 | 0.28% |
| Perry | 0 | 1 | 2 | 0 | 0 | 3 | 0.01% |
| Philadelphia | 4 | 11 | 18 | 5 | 3 | 41 | 0.20% |
| Pike | 27 | 27 | 10 | 0 | 0 | 64 | 0.32% |
| Potter | 0 | 0 | 1 | 0 | 0 | 1 | 0.00% |
| Schuylkill | 5 | 5 | 8 | 23 | 15 | 56 | 0.28% |
| Snyder | 1 | 0 | 0 | 0 | 0 | 1 | 0.00% |
| Somerset | 37 | 17 | 35 | 52 | 27 | 168 | 0.84% |
| Tioga | 2 | 0 | 0 | 0 | 3 | 5 | 0.02% |
| Union | 13 | 16 | 16 | 38 | 8 | 91 | 0.45% |
| Venango | 33 | 27 | 53 | 22 | 19 | 154 | 0.77% |
| Warren | 12 | 2 | 9 | 9 | 0 | 32 | 0.16% |
| Washington | 105 | 87 | 19 | 25 | 31 | 267 | 1.33% |
| Wayne | 0 | 0 | 0 | 0 | 1 | 1 | 0.00% |
| Westmoreland | 66 | 47 | 118 | 94 | 107 | 432 | 2.16% |
| Wyoming | 3 | 2 | 0 | 0 | 2 | 7 | 0.03% |
| York | 73 | 64 | 56 | 46 | 1 | 240 | 1.20% |
| Grand Total | 6,478 | 6,621 | 5,998 | 5,945 | 5,820 | 30,862 | N/A |