
News
Traffic citations in school zones increased by 32% last year

News Article
August 20, 2020
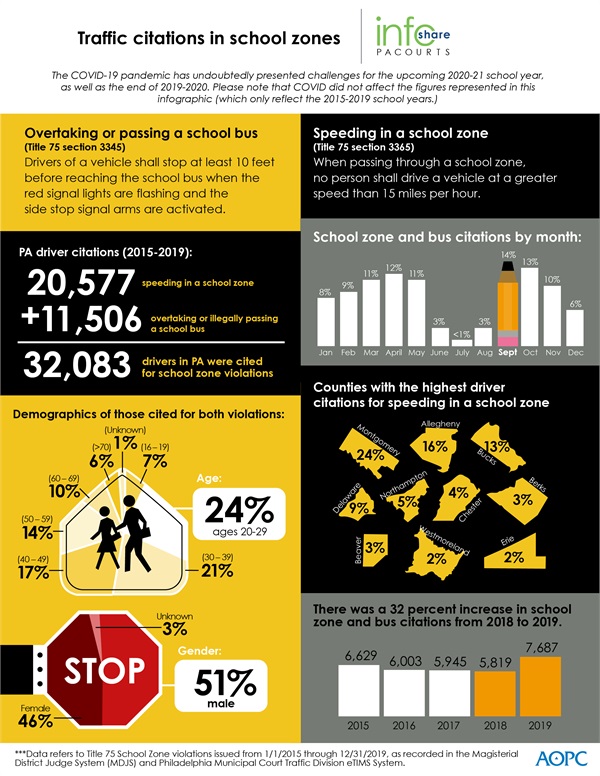
In Pennsylvania, there was a 32 percent increase in school zone traffic violations from 2018-2019. Over the last five years, 32,083 drivers in total were cited for either speeding in school zones or illegally passing a school bus.
The infographic below highlights statewide data and demographics about traffic citations in school zones in Pennsylvania over the last five years. Download a high-resolution version of the graphic. County-level detail is provided at the end of the release. Please note that the COVID pandemic did not affect the numbers represented in this graphic (which only reflect the 2015-2019 school years).
PA Courts InfoShare is a monthly product of the Administrative Office of Pennsylvania Courts (AOPC) that visually highlights the work of the courts with interesting data and statistics obtained through the judiciary’s case management systems, interactive dashboards and other research. Reproduction is permissible with source cited.
##
Media contact: Kimberly Bathgate, 717-231-3331 or 717-576-4373
Editor’s note:
Title 75 School Zone violations issued from 1/1/2015 through 12/31/2019, as recorded in the Magisterial District Judge System (MDJS) and Philadelphia Municipal Court Traffic Division eTIMS System.; County Composition | |||||||
Section / Offense Description | Filed Year | Total | Percentage of Overall | ||||
2015 | 2016 | 2017 | 2018 | 2019 | |||
3345 / Meeting/Overtaking School Bus | 2,225 | 2,039 | 2,292 | 2,285 | 2,665 | 11,506 | N/A |
Adams | 17 | 14 | 31 | 4 | 13 | 79 | 0.69% |
Allegheny | 374 | 286 | 453 | 433 | 564 | 2,110 | 18.34% |
Armstrong | 19 | 16 | 4 | 8 | 5 | 52 | 0.45% |
Beaver | 27 | 25 | 28 | 15 | 9 | 104 | 0.90% |
Bedford | 4 | 6 | 0 | 3 | 5 | 18 | 0.16% |
Berks | 51 | 98 | 149 | 122 | 84 | 504 | 4.38% |
Blair | 14 | 25 | 14 | 5 | 14 | 72 | 0.63% |
Bradford | 11 | 7 | 1 | 7 | 4 | 30 | 0.26% |
Bucks | 164 | 146 | 200 | 169 | 196 | 875 | 7.60% |
Butler | 89 | 90 | 38 | 64 | 83 | 364 | 3.16% |
Cambria | 18 | 16 | 21 | 17 | 11 | 83 | 0.72% |
Cameron | 0 | 0 | 2 | 0 | 0 | 2 | 0.02% |
Carbon | 3 | 15 | 10 | 6 | 5 | 39 | 0.34% |
Centre | 21 | 35 | 50 | 31 | 40 | 177 | 1.54% |
Chester | 165 | 157 | 161 | 155 | 153 | 791 | 6.87% |
Clarion | 1 | 8 | 7 | 7 | 4 | 27 | 0.23% |
Clearfield | 3 | 9 | 3 | 7 | 4 | 26 | 0.23% |
Clinton | 0 | 4 | 2 | 2 | 8 | 16 | 0.14% |
Columbia | 7 | 18 | 13 | 14 | 23 | 75 | 0.65% |
Crawford | 14 | 4 | 9 | 9 | 4 | 40 | 0.35% |
Cumberland | 39 | 28 | 26 | 30 | 33 | 156 | 1.36% |
Dauphin | 107 | 67 | 86 | 63 | 62 | 385 | 3.35% |
Delaware | 158 | 133 | 119 | 125 | 195 | 730 | 6.34% |
Elk | 2 | 0 | 1 | 3 | 3 | 9 | 0.08% |
Erie | 69 | 41 | 42 | 49 | 46 | 247 | 2.15% |
Fayette | 2 | 6 | 11 | 5 | 9 | 33 | 0.29% |
Franklin | 17 | 7 | 9 | 7 | 13 | 53 | 0.46% |
Fulton | 5 | 2 | 1 | 4 | 1 | 13 | 0.11% |
Greene | 7 | 1 | 4 | 0 | 7 | 19 | 0.17% |
Huntingdon | 3 | 1 | 2 | 2 | 3 | 11 | 0.10% |
Indiana | 11 | 8 | 3 | 5 | 13 | 40 | 0.35% |
Jefferson | 18 | 11 | 7 | 5 | 8 | 49 | 0.43% |
Juniata | 3 | 0 | 2 | 2 | 1 | 8 | 0.07% |
Lackawanna | 24 | 28 | 44 | 39 | 21 | 156 | 1.36% |
Lancaster | 50 | 52 | 60 | 75 | 80 | 317 | 2.76% |
Lawrence | 9 | 8 | 4 | 9 | 6 | 36 | 0.31% |
Lebanon | 4 | 9 | 12 | 6 | 7 | 38 | 0.33% |
Lehigh | 85 | 58 | 70 | 60 | 64 | 337 | 2.93% |
Luzerne | 24 | 30 | 18 | 36 | 53 | 161 | 1.40% |
Lycoming | 9 | 15 | 12 | 7 | 12 | 55 | 0.48% |
McKean | 3 | 6 | 2 | 4 | 2 | 17 | 0.15% |
Mercer | 29 | 18 | 14 | 9 | 7 | 77 | 0.67% |
Mifflin | 3 | 3 | 7 | 9 | 10 | 32 | 0.28% |
Monroe | 19 | 19 | 18 | 12 | 20 | 88 | 0.76% |
Montgomery | 204 | 173 | 219 | 334 | 379 | 1,309 | 11.38% |
Montour | 1 | 1 | 0 | 0 | 2 | 4 | 0.03% |
Northampton | 66 | 54 | 52 | 34 | 56 | 262 | 2.28% |
Northumberland | 6 | 5 | 5 | 11 | 10 | 37 | 0.32% |
Perry | 5 | 3 | 6 | 3 | 2 | 19 | 0.17% |
Philadelphia | 73 | 82 | 71 | 64 | 68 | 358 | 3.11% |
Pike | 8 | 7 | 4 | 2 | 1 | 22 | 0.19% |
Potter | 2 | 0 | 0 | 2 | 2 | 6 | 0.05% |
Schuylkill | 18 | 8 | 29 | 14 | 15 | 84 | 0.73% |
Snyder | 4 | 2 | 1 | 2 | 8 | 17 | 0.15% |
Somerset | 1 | 3 | 4 | 1 | 3 | 12 | 0.10% |
Sullivan | 0 | 1 | 2 | 0 | 1 | 4 | 0.03% |
Susquehanna | 1 | 5 | 3 | 3 | 3 | 15 | 0.13% |
Tioga | 4 | 4 | 1 | 1 | 3 | 13 | 0.11% |
Union | 2 | 1 | 1 | 3 | 6 | 13 | 0.11% |
Venango | 3 | 6 | 11 | 15 | 7 | 42 | 0.37% |
Warren | 1 | 5 | 2 | 1 | 2 | 11 | 0.10% |
Washington | 34 | 24 | 25 | 25 | 35 | 143 | 1.24% |
Wayne | 3 | 8 | 3 | 0 | 9 | 23 | 0.20% |
Westmoreland | 22 | 34 | 21 | 36 | 32 | 145 | 1.26% |
Wyoming | 0 | 6 | 9 | 4 | 9 | 28 | 0.24% |
York | 65 | 77 | 53 | 86 | 107 | 388 | 3.37% |
3365 / Speeding In School Zone | 4,404 | 3,964 | 3,653 | 3,534 | 5,022 | 20,577 | N/A |
Adams | 113 | 61 | 76 | 52 | 62 | 364 | 1.77% |
Allegheny | 907 | 653 | 714 | 453 | 483 | 3,210 | 15.60% |
Armstrong | 3 | 6 | 1 | 2 | 0 | 12 | 0.06% |
Beaver | 215 | 160 | 74 | 54 | 106 | 609 | 2.96% |
Bedford | 0 | 0 | 1 | 2 | 3 | 6 | 0.03% |
Berks | 174 | 142 | 114 | 119 | 130 | 679 | 3.30% |
Blair | 3 | 112 | 22 | 17 | 4 | 158 | 0.77% |
Bradford | 1 | 3 | 0 | 0 | 0 | 4 | 0.02% |
Bucks | 490 | 616 | 440 | 508 | 553 | 2,607 | 12.67% |
Butler | 20 | 40 | 35 | 28 | 34 | 157 | 0.76% |
Cambria | 30 | 16 | 16 | 16 | 17 | 95 | 0.46% |
Cameron | 0 | 0 | 0 | 1 | 0 | 1 | 0.00% |
Carbon | 14 | 5 | 2 | 15 | 19 | 55 | 0.27% |
Centre | 3 | 3 | 7 | 7 | 2 | 22 | 0.11% |
Chester | 120 | 146 | 149 | 174 | 146 | 735 | 3.57% |
Clarion | 1 | 1 | 6 | 1 | 0 | 9 | 0.04% |
Clearfield | 29 | 0 | 1 | 2 | 0 | 32 | 0.16% |
Clinton | 16 | 6 | 17 | 0 | 2 | 41 | 0.20% |
Columbia | 0 | 0 | 0 | 1 | 1 | 2 | 0.01% |
Crawford | 4 | 12 | 16 | 26 | 8 | 66 | 0.32% |
Cumberland | 60 | 63 | 32 | 38 | 69 | 262 | 1.27% |
Dauphin | 59 | 83 | 39 | 23 | 41 | 245 | 1.19% |
Delaware | 510 | 308 | 271 | 231 | 533 | 1,853 | 9.01% |
Elk | 6 | 5 | 6 | 6 | 1 | 24 | 0.12% |
Erie | 67 | 47 | 65 | 90 | 135 | 404 | 1.96% |
Fayette | 5 | 2 | 4 | 0 | 1 | 12 | 0.06% |
Franklin | 13 | 12 | 13 | 22 | 56 | 116 | 0.56% |
Fulton | 7 | 0 | 1 | 2 | 1 | 11 | 0.05% |
Greene | 7 | 4 | 9 | 1 | 1 | 22 | 0.11% |
Huntingdon | 2 | 3 | 0 | 0 | 2 | 7 | 0.03% |
Indiana | 6 | 1 | 3 | 7 | 0 | 17 | 0.08% |
Jefferson | 6 | 0 | 0 | 1 | 5 | 12 | 0.06% |
Juniata | 4 | 2 | 0 | 0 | 0 | 6 | 0.03% |
Lackawanna | 8 | 13 | 11 | 19 | 22 | 73 | 0.35% |
Lancaster | 7 | 33 | 17 | 12 | 19 | 88 | 0.43% |
Lawrence | 11 | 1 | 12 | 3 | 3 | 30 | 0.15% |
Lebanon | 32 | 28 | 28 | 17 | 54 | 159 | 0.77% |
Lehigh | 82 | 109 | 32 | 22 | 75 | 320 | 1.56% |
Luzerne | 28 | 61 | 35 | 76 | 33 | 233 | 1.13% |
Lycoming | 0 | 2 | 19 | 20 | 17 | 58 | 0.28% |
McKean | 0 | 0 | 0 | 2 | 2 | 4 | 0.02% |
Mercer | 20 | 19 | 6 | 40 | 23 | 108 | 0.52% |
Monroe | 1 | 2 | 0 | 0 | 0 | 3 | 0.01% |
Montgomery | 704 | 621 | 791 | 1,013 | 1,836 | 4,965 | 24.13% |
Montour | 0 | 0 | 1 | 0 | 0 | 1 | 0.00% |
Northampton | 287 | 199 | 247 | 191 | 262 | 1,186 | 5.76% |
Northumberland | 23 | 19 | 6 | 3 | 0 | 51 | 0.25% |
Perry | 1 | 2 | 0 | 0 | 0 | 3 | 0.01% |
Philadelphia | 11 | 18 | 5 | 3 | 5 | 42 | 0.20% |
Pike | 27 | 10 | 0 | 0 | 0 | 37 | 0.18% |
Potter | 0 | 1 | 0 | 0 | 7 | 8 | 0.04% |
Schuylkill | 5 | 8 | 23 | 15 | 14 | 65 | 0.32% |
Somerset | 17 | 35 | 52 | 27 | 9 | 140 | 0.68% |
Tioga | 0 | 0 | 0 | 3 | 0 | 3 | 0.01% |
Union | 16 | 16 | 38 | 8 | 11 | 89 | 0.43% |
Venango | 27 | 53 | 22 | 19 | 17 | 138 | 0.67% |
Warren | 2 | 9 | 9 | 0 | 0 | 20 | 0.10% |
Washington | 87 | 19 | 25 | 31 | 30 | 192 | 0.93% |
Wayne | 0 | 0 | 0 | 1 | 0 | 1 | 0.00% |
Westmoreland | 47 | 118 | 94 | 107 | 125 | 491 | 2.39% |
Wyoming | 2 | 0 | 0 | 2 | 1 | 5 | 0.02% |
York | 64 | 56 | 46 | 1 | 42 | 209 | 1.02% |
Grand Total | 6,629 | 6,003 | 5,945 | 5,819 | 7,687 | 32,083 | N/A |