
News
Drug Delivery Resulting in Death Charges in Pennsylvania

News Article
September 11, 2020
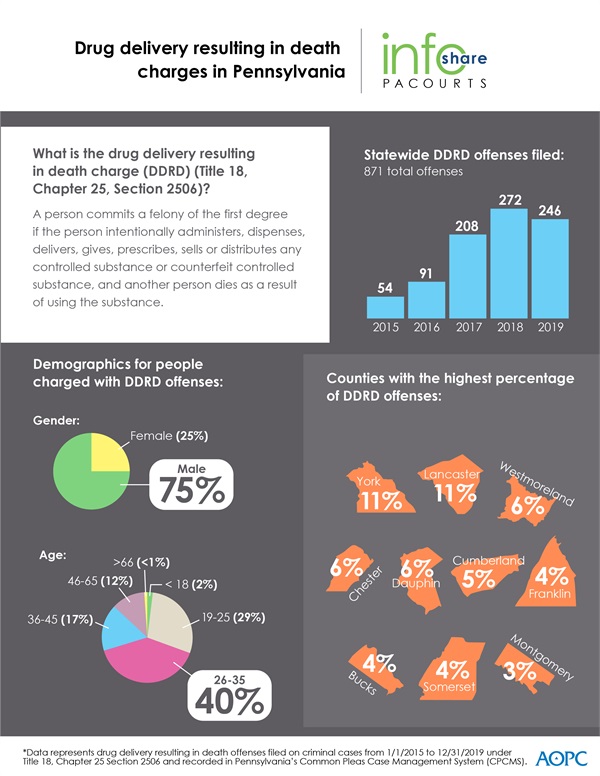
Drug delivery resulting in death (DDRD) charges statewide have increased by 356 percent between 2015 and 2019. In Pennsylvania, a DDRD charge is issued to a person who intentionally administers, dispenses, delivers, gives, prescribes, sells or distributes any controlled substance or counterfeit controlled substance, and another person dies as a result of using the substance.
The infographic below highlights key data and demographics about DDRD charges in Pennsylvania over the past five years. Download a high-resolution file of the graphic and view county-by-county stats included at the end of this release.
PA Courts InfoShare is a monthly product of the Administrative Office of Pennsylvania Courts (AOPC) that visually highlights the work of the courts with interesting data and statistics obtained through the judiciary’s case management systems, interactive dashboards and other research. Reproduction is encouraged with source cited.
##
Media contact: Kim Bathgate, 717-231-3331
Editor’s Note:
Statewide number of offenses filed on criminal cases from 1/1/2015 through 12/31/2019 for a Drug Delivery Resulting in Death Offense; Grouped by County
| County | 2015 | 2016 | 2017 | 2018 | 2019 | Total | Percentage of Total |
| Adams | 0 | 0 | 1 | 1 | 0 | 2 | 0.23% |
| Allegheny | 0 | 1 | 5 | 10 | 3 | 19 | 2.18% |
| Armstrong | 0 | 0 | 1 | 1 | 6 | 8 | 0.92% |
| Beaver | 0 | 2 | 10 | 3 | 4 | 19 | 2.18% |
| Bedford | 0 | 0 | 0 | 2 | 0 | 2 | 0.23% |
| Berks | 2 | 1 | 1 | 5 | 4 | 13 | 1.49% |
| Blair | 1 | 5 | 13 | 1 | 2 | 22 | 2.53% |
| Bucks | 6 | 6 | 6 | 14 | 4 | 36 | 4.13% |
| Butler | 1 | 4 | 2 | 1 | 4 | 12 | 1.38% |
| Cambria | 0 | 0 | 1 | 1 | 2 | 4 | 0.46% |
| Centre | 0 | 0 | 4 | 6 | 1 | 11 | 1.26% |
| Chester | 3 | 0 | 9 | 25 | 12 | 49 | 5.63% |
| Clarion | 0 | 1 | 2 | 3 | 6 | 12 | 1.38% |
| Clearfield | 1 | 0 | 0 | 0 | 0 | 1 | 0.11% |
| Clinton | 0 | 0 | 1 | 0 | 0 | 1 | 0.11% |
| Columbia | 0 | 2 | 0 | 0 | 0 | 2 | 0.23% |
| Crawford | 0 | 0 | 1 | 3 | 1 | 5 | 0.57% |
| Cumberland | 6 | 2 | 7 | 14 | 14 | 43 | 4.94% |
| Dauphin | 3 | 6 | 15 | 17 | 7 | 48 | 5.51% |
| Delaware | 0 | 0 | 3 | 2 | 4 | 9 | 1.03% |
| Elk | 0 | 0 | 0 | 5 | 4 | 9 | 1.03% |
| Erie | 0 | 0 | 1 | 11 | 1 | 13 | 1.49% |
| Fayette | 0 | 0 | 0 | 5 | 3 | 8 | 0.92% |
| Franklin | 2 | 2 | 17 | 14 | 2 | 37 | 4.25% |
| Fulton | 0 | 2 | 0 | 0 | 0 | 2 | 0.23% |
| Huntingdon | 0 | 0 | 0 | 1 | 1 | 2 | 0.23% |
| Indiana | 0 | 0 | 0 | 1 | 0 | 1 | 0.11% |
| Jefferson | 0 | 0 | 0 | 2 | 0 | 2 | 0.23% |
| Juniata | 1 | 0 | 0 | 0 | 0 | 1 | 0.11% |
| Lackawanna | 0 | 3 | 0 | 3 | 2 | 8 | 0.92% |
| Lancaster | 0 | 10 | 25 | 43 | 21 | 99 | 11.37% |
| Lawrence | 0 | 0 | 0 | 1 | 1 | 2 | 0.23% |
| Lebanon | 8 | 9 | 1 | 1 | 0 | 19 | 2.18% |
| Lehigh | 0 | 0 | 0 | 4 | 2 | 6 | 0.69% |
| Luzerne | 0 | 0 | 5 | 0 | 1 | 6 | 0.69% |
| Lycoming | 3 | 1 | 0 | 0 | 0 | 4 | 0.46% |
| McKean | 0 | 0 | 3 | 0 | 0 | 3 | 0.34% |
| Mercer | 0 | 0 | 0 | 2 | 2 | 4 | 0.46% |
| Mifflin | 2 | 1 | 0 | 0 | 1 | 4 | 0.46% |
| Monroe | 1 | 5 | 1 | 8 | 11 | 26 | 2.99% |
| Montgomery | 0 | 3 | 11 | 3 | 13 | 30 | 3.44% |
| Northampton | 0 | 2 | 1 | 1 | 2 | 6 | 0.69% |
| Northumberland | 1 | 0 | 0 | 2 | 0 | 3 | 0.34% |
| Philadelphia | 0 | 6 | 6 | 0 | 1 | 13 | 1.49% |
| Pike | 0 | 0 | 0 | 15 | 12 | 27 | 3.10% |
| Potter | 0 | 1 | 1 | 0 | 0 | 2 | 0.23% |
| Schuylkill | 0 | 2 | 3 | 1 | 0 | 6 | 0.69% |
| Snyder | 0 | 1 | 0 | 1 | 0 | 2 | 0.23% |
| Somerset | 0 | 2 | 13 | 6 | 11 | 32 | 3.67% |
| Tioga | 0 | 1 | 0 | 0 | 0 | 1 | 0.11% |
| Venango | 0 | 2 | 0 | 1 | 4 | 7 | 0.80% |
| Warren | 0 | 1 | 0 | 0 | 2 | 3 | 0.34% |
| Washington | 0 | 1 | 3 | 0 | 4 | 8 | 0.92% |
| Wayne | 0 | 1 | 0 | 0 | 4 | 5 | 0.57% |
| Westmoreland | 3 | 0 | 11 | 14 | 23 | 51 | 5.86% |
| Wyoming | 0 | 0 | 0 | 0 | 1 | 1 | 0.11% |
| York | 10 | 5 | 24 | 18 | 43 | 100 | 11.48% |
| Grand Total | 54 | 91 | 208 | 272 | 246 | 871 | n/a |