
News
A look at Pennsylvania child abuse data during Child Abuse Awareness Month

News Article
April 05, 2024
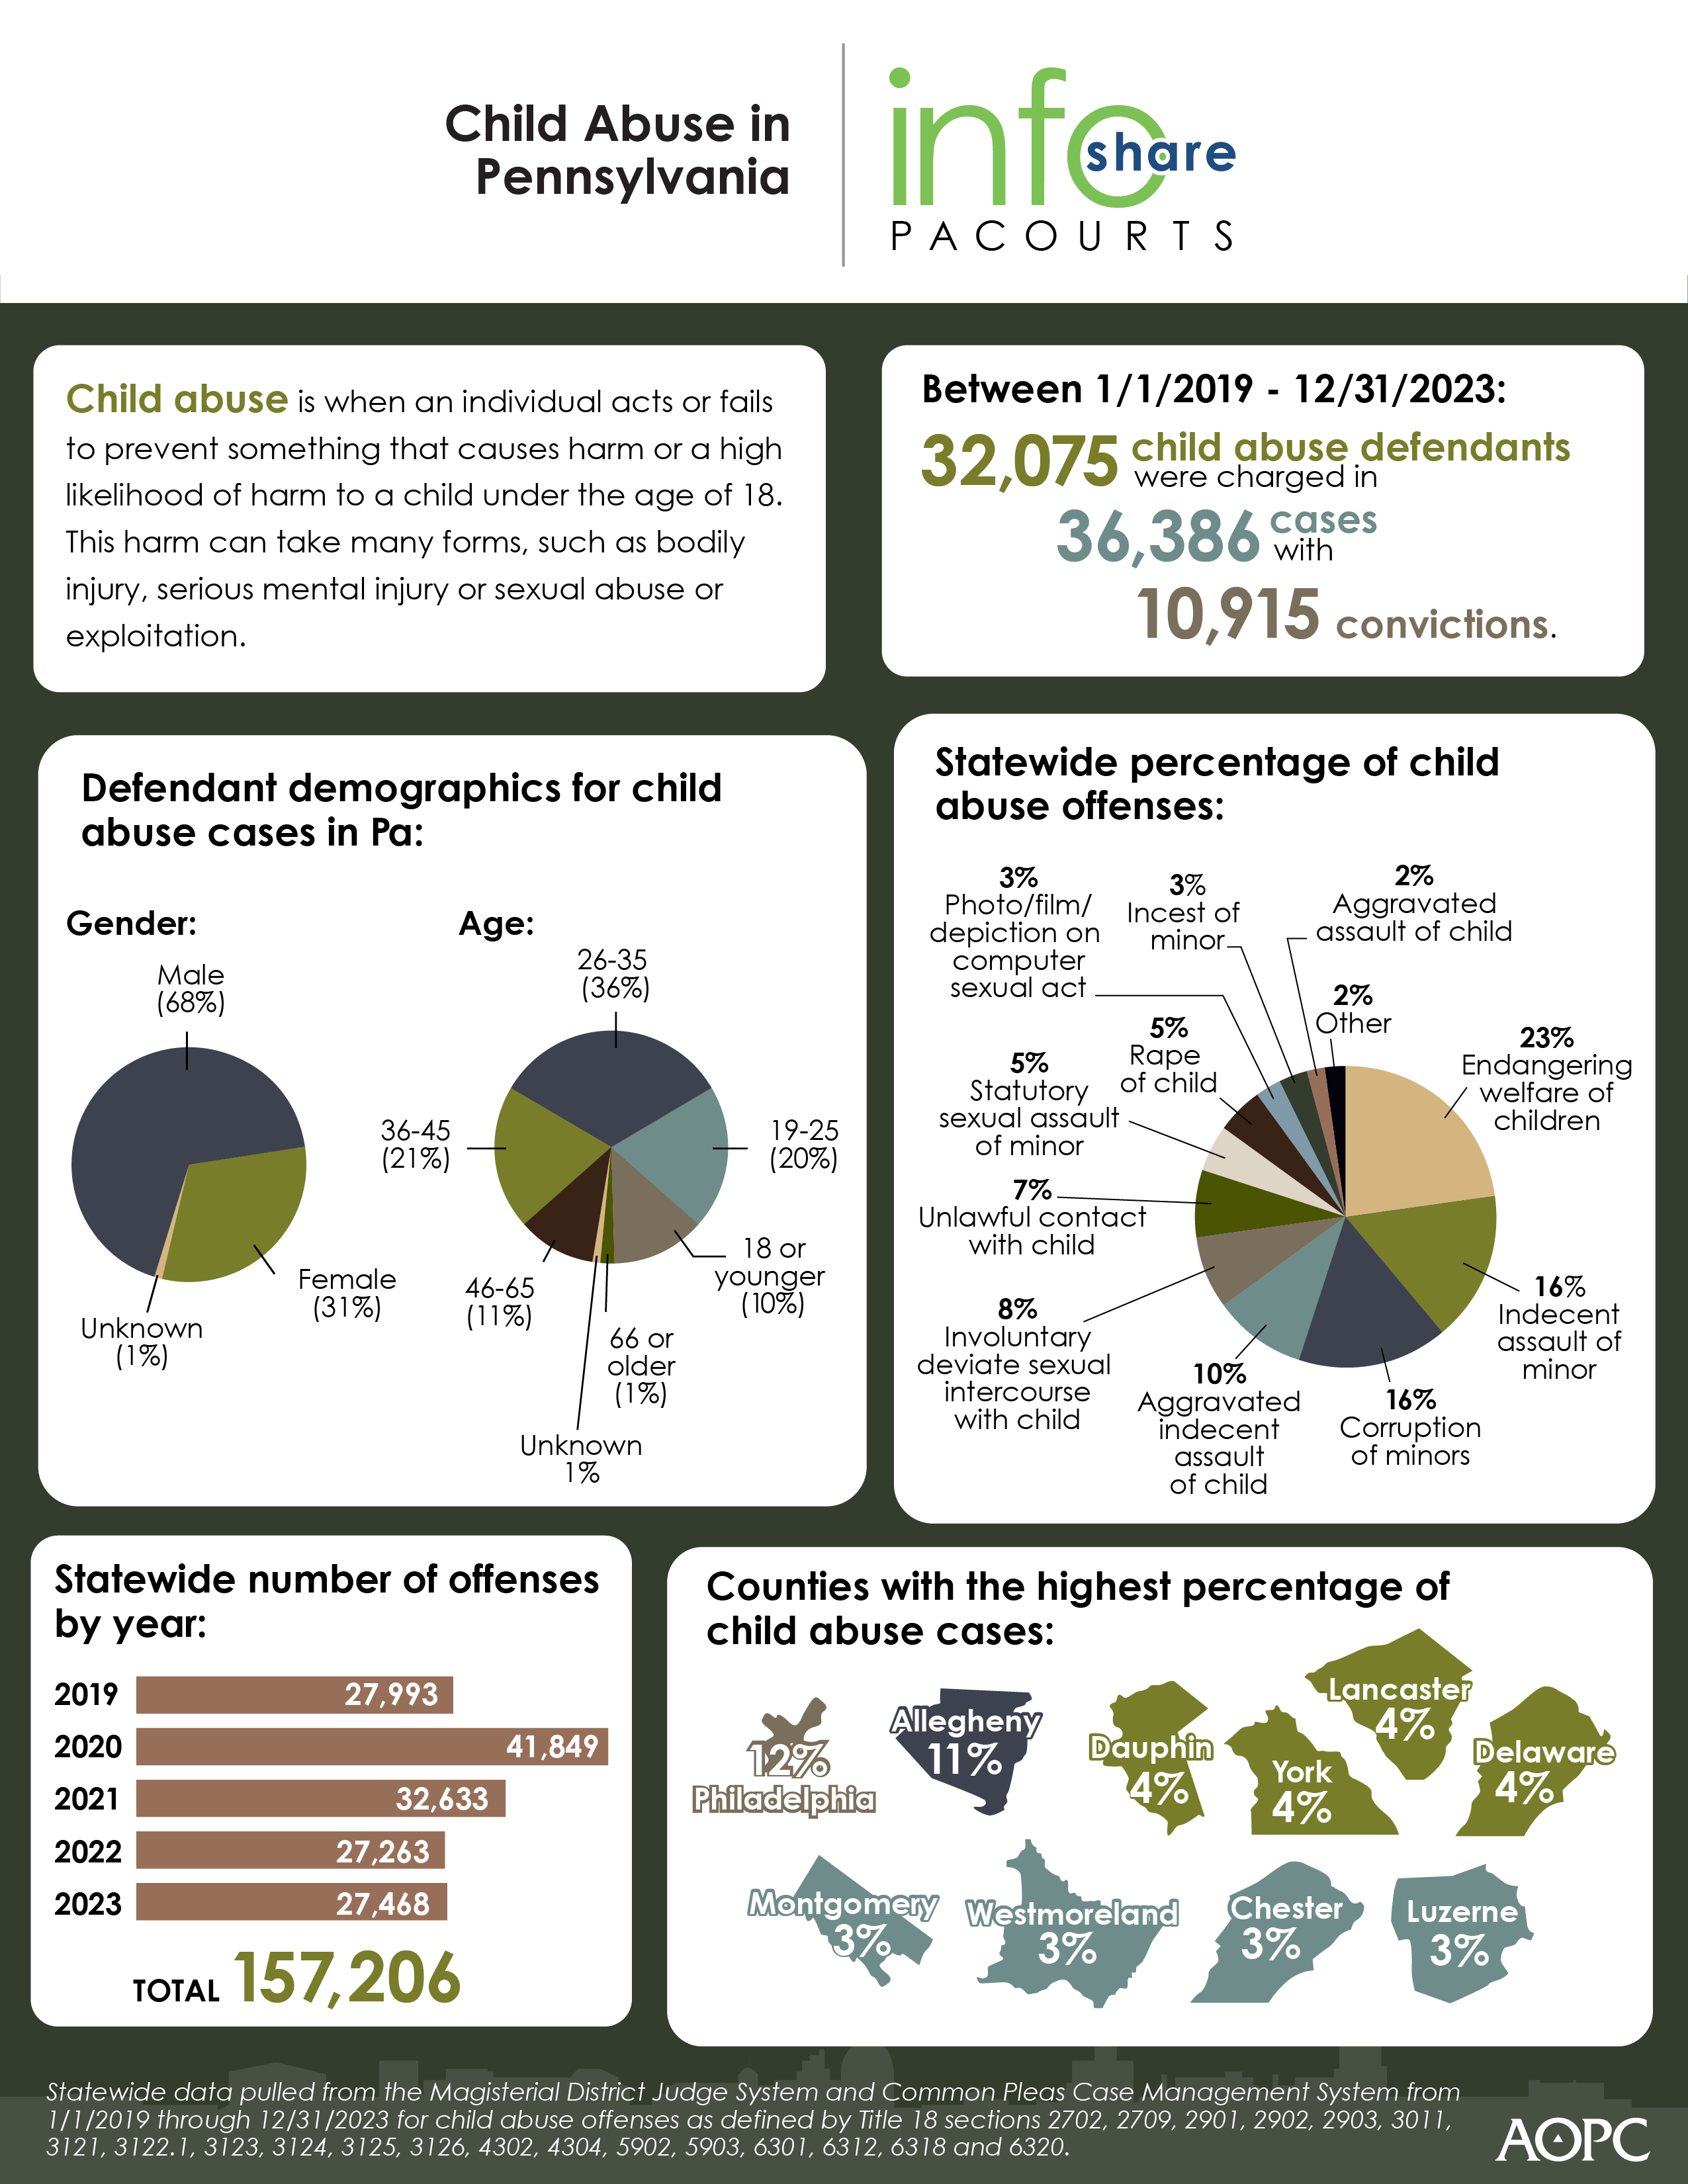
Under Pennsylvania’s child abuse laws, 32,075 people were charged in 36,386 child abuse cases between 2019 to 2023, resulting in 10,915 case convictions. Of those defendants who were charged in child abuse cases, 56% were between the ages of 19-35 and 23% were charged with endangering the welfare of children.
The infographic below highlights key data and demographics about child abuse in Pennsylvania. Download a high-resolution version of the graphic. See editor’s note for county data detail.
PA Courts InfoShare is a monthly product of the Administrative Office of Pennsylvania Courts (AOPC) that visually highlights the work of the courts with interesting data and statistics obtained through the judiciary’s case management systems, interactive dashboards and other research. Reproduction is permissible with source cited.
##
Media contact: Kim Bathgate, 717-576-4373
Editor’s Note:
Statewide data pulled from the Magisterial District Judge System and Common Pleas Case Management System from 1/1/2019 through 12/31/2023 for child abuse offenses as defined by Title 18 sections 2702, 2709, 2901, 2902, 2903, 3011, 3121, 3122.1, 3123, 3124, 3125, 3126, 4302, 4304, 5902, 5903, 6301, 6312, 6318 and 6320.
|
Statewide number of cases filed from 1/1/2019 through 12/31/2023 for Child Abuse offenses, as recorded in the Magisterial District Judge System (MDJS) and Common Pleas Case Management System (CPCMS); Grouped by County |
|||||||
|
County |
2019 |
2020 |
2021 |
2022 |
2023 |
Grand Total |
% of Total |
|
Adams |
54 |
52 |
80 |
68 |
52 |
306 |
0.84% |
|
Allegheny |
997 |
834 |
814 |
742 |
721 |
4,108 |
11.29% |
|
Armstrong |
61 |
70 |
60 |
75 |
42 |
308 |
0.85% |
|
Beaver |
114 |
118 |
111 |
129 |
122 |
594 |
1.63% |
|
Bedford |
55 |
36 |
26 |
35 |
37 |
189 |
0.52% |
|
Berks |
154 |
133 |
148 |
137 |
105 |
677 |
1.86% |
|
Blair |
128 |
124 |
112 |
112 |
153 |
629 |
1.73% |
|
Bradford |
78 |
52 |
52 |
34 |
37 |
253 |
0.70% |
|
Bucks |
151 |
118 |
110 |
129 |
124 |
632 |
1.74% |
|
Butler |
76 |
83 |
60 |
71 |
66 |
356 |
0.98% |
|
Cambria |
124 |
124 |
124 |
103 |
85 |
560 |
1.54% |
|
Cameron |
2 |
15 |
8 |
5 |
|
30 |
0.08% |
|
Carbon |
59 |
62 |
49 |
48 |
39 |
257 |
0.71% |
|
Centre |
31 |
34 |
21 |
32 |
27 |
145 |
0.40% |
|
Chester |
228 |
227 |
224 |
186 |
165 |
1,030 |
2.83% |
|
Clarion |
50 |
24 |
36 |
23 |
19 |
152 |
0.42% |
|
Clearfield |
57 |
51 |
48 |
93 |
65 |
314 |
0.86% |
|
Clinton |
22 |
29 |
29 |
23 |
27 |
130 |
0.36% |
|
Columbia |
57 |
53 |
43 |
41 |
29 |
223 |
0.61% |
|
Crawford |
53 |
43 |
37 |
51 |
39 |
223 |
0.61% |
|
Cumberland |
189 |
202 |
139 |
180 |
159 |
869 |
2.39% |
|
Dauphin |
316 |
320 |
348 |
335 |
286 |
1,605 |
4.41% |
|
Delaware |
282 |
288 |
296 |
251 |
306 |
1,423 |
3.91% |
|
Elk |
27 |
46 |
38 |
35 |
25 |
171 |
0.47% |
|
Erie |
116 |
151 |
153 |
131 |
147 |
698 |
1.92% |
|
Fayette |
98 |
115 |
89 |
83 |
110 |
495 |
1.36% |
|
Forest |
6 |
2 |
4 |
4 |
3 |
19 |
0.05% |
|
Franklin |
162 |
138 |
93 |
97 |
98 |
588 |
1.62% |
|
Fulton |
12 |
13 |
12 |
6 |
14 |
57 |
0.16% |
|
Greene |
28 |
20 |
19 |
26 |
26 |
119 |
0.33% |
|
Huntingdon |
44 |
24 |
41 |
33 |
16 |
158 |
0.43% |
|
Indiana |
74 |
60 |
37 |
43 |
40 |
254 |
0.70% |
|
Jefferson |
48 |
74 |
59 |
44 |
50 |
275 |
0.76% |
|
Juniata |
20 |
10 |
15 |
27 |
14 |
86 |
0.24% |
|
Lackawanna |
188 |
153 |
145 |
146 |
170 |
802 |
2.20% |
|
Lancaster |
298 |
250 |
263 |
259 |
261 |
1,331 |
3.66% |
|
Lawrence |
50 |
54 |
45 |
34 |
55 |
238 |
0.65% |
|
Lebanon |
92 |
46 |
51 |
36 |
34 |
259 |
0.71% |
|
Lehigh |
55 |
50 |
56 |
49 |
75 |
285 |
0.78% |
|
Luzerne |
197 |
164 |
254 |
173 |
136 |
924 |
2.54% |
|
Lycoming |
115 |
103 |
108 |
140 |
85 |
551 |
1.51% |
|
McKean |
33 |
43 |
33 |
25 |
30 |
164 |
0.45% |
|
Mercer |
145 |
129 |
144 |
113 |
110 |
641 |
1.76% |
|
Mifflin |
23 |
22 |
36 |
19 |
24 |
124 |
0.34% |
|
Monroe |
189 |
170 |
161 |
139 |
119 |
778 |
2.14% |
|
Montgomery |
267 |
250 |
230 |
262 |
219 |
1,228 |
3.37% |
|
Montour |
14 |
10 |
8 |
4 |
11 |
47 |
0.13% |
|
Northampton |
156 |
95 |
99 |
100 |
97 |
547 |
1.50% |
|
Northumberland |
99 |
91 |
96 |
58 |
95 |
439 |
1.21% |
|
Perry |
43 |
49 |
54 |
54 |
46 |
246 |
0.68% |
|
Philadelphia |
989 |
692 |
1,001 |
864 |
985 |
4,531 |
12.45% |
|
Pike |
37 |
26 |
30 |
30 |
23 |
146 |
0.40% |
|
Potter |
40 |
30 |
21 |
16 |
6 |
113 |
0.31% |
|
Schuylkill |
105 |
87 |
82 |
70 |
63 |
407 |
1.12% |
|
Snyder |
41 |
52 |
31 |
27 |
20 |
171 |
0.47% |
|
Somerset |
77 |
70 |
66 |
64 |
54 |
331 |
0.91% |
|
Sullivan |
2 |
6 |
3 |
10 |
7 |
28 |
0.08% |
|
Susquehanna |
10 |
25 |
26 |
20 |
13 |
94 |
0.26% |
|
Tioga |
22 |
23 |
19 |
21 |
22 |
107 |
0.29% |
|
Union |
34 |
22 |
30 |
23 |
16 |
125 |
0.34% |
|
Venango |
88 |
89 |
62 |
70 |
66 |
375 |
1.03% |
|
Warren |
46 |
40 |
37 |
26 |
36 |
185 |
0.51% |
|
Washington |
105 |
105 |
94 |
88 |
117 |
509 |
1.40% |
|
Wayne |
29 |
31 |
23 |
29 |
17 |
129 |
0.35% |
|
Westmoreland |
211 |
238 |
225 |
249 |
241 |
1,164 |
3.20% |
|
Wyoming |
18 |
24 |
26 |
13 |
27 |
108 |
0.30% |
|
York |
326 |
308 |
244 |
207 |
241 |
1,326 |
3.64% |
|
Grand Total |
8,117 |
7,292 |
7,338 |
6,870 |
6,769 |
36,386 |
N/A |