
News
Drug Delivery Resulting in Death Citations at Five-year High

News Article
March 08, 2018
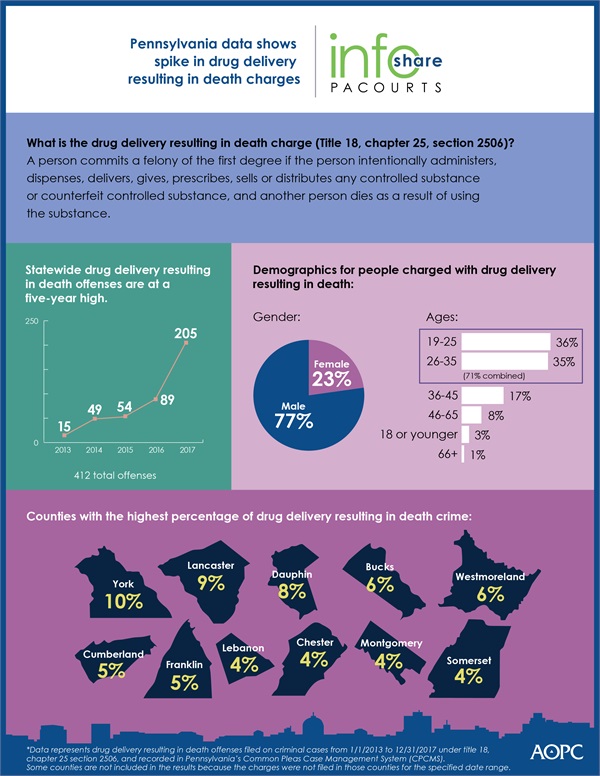
Drug delivery resulting in death charges statewide have increased by 1,267 percent between 2013 and 2017. In Pennsylvania, a drug delivery resulting in death charge is issued to a person who intentionally administers, dispenses, delivers, gives, prescribes, sells or distributes any controlled substance or counterfeit controlled substance, and another person dies as a result of using the substance.
Data is based on the following state law: Title 18, section 2506. The infographic below highlights key data and demographics about drug delivery resulting in death in Pennsylvania. Or download a high-resolution file of the graphic.
County-specific data is available at the end of the news release. Some counties are not included in the results because the charges were not filed in those counties for the specified date range.
PA Courts InfoShare is a monthly product of the Administrative Office of Pennsylvania Courts (AOPC) that visually highlights the work of the courts with interesting data and statistics obtained through the judiciary’s case management systems, interactive dashboards and other research. Reproduction is encouraged with source cited.
##
Media contact: Kim Bathgate, 717-231-3331
Editor’s Note:
County-specific drug delivery resulting in death data. Some counties are not included in the results because the charges were not filed in those counties for the specified date range.
| County | 2013 | 2014 | 2015 | 2016 | 2017 | Total | Percentage of Total |
| Adams | 0 | 0 | 0 | 0 | 1 | 1 | 0.24% |
| Allegheny | 0 | 0 | 0 | 1 | 6 | 7 | 1.70% |
| Armstrong | 0 | 0 | 0 | 0 | 1 | 1 | 0.24% |
| Beaver | 0 | 0 | 0 | 2 | 9 | 11 | 2.67% |
| Berks | 0 | 0 | 2 | 1 | 1 | 4 | 0.97% |
| Blair | 0 | 0 | 1 | 5 | 13 | 19 | 4.61% |
| Bradford | 1 | 1 | 0 | 0 | 0 | 2 | 0.49% |
| Bucks | 2 | 3 | 6 | 6 | 6 | 23 | 5.58% |
| Butler | 0 | 1 | 1 | 4 | 2 | 8 | 1.94% |
| Cambria | 0 | 0 | 0 | 0 | 1 | 1 | 0.24% |
| Centre | 0 | 1 | 0 | 0 | 4 | 5 | 1.21% |
| Chester | 0 | 3 | 3 | 0 | 9 | 15 | 3.64% |
| Clarion | 1 | 0 | 0 | 1 | 2 | 4 | 0.97% |
| Clearfield | 1 | 0 | 1 | 0 | 0 | 2 | 0.49% |
| Clinton | 0 | 0 | 0 | 0 | 1 | 1 | 0.24% |
| Columbia | 0 | 0 | 0 | 2 | 0 | 2 | 0.49% |
| Crawford | 0 | 0 | 0 | 0 | 1 | 1 | 0.24% |
| Cumberland | 2 | 3 | 6 | 2 | 7 | 20 | 4.85% |
| Dauphin | 0 | 7 | 3 | 6 | 15 | 31 | 7.52% |
| Delaware | 0 | 1 | 0 | 0 | 3 | 4 | 0.97% |
| Erie | 0 | 1 | 0 | 0 | 1 | 2 | 0.49% |
| Fayette | 0 | 1 | 0 | 0 | 0 | 1 | 0.24% |
| Franklin | 0 | 1 | 2 | 2 | 17 | 22 | 5.34% |
| Fulton | 0 | 0 | 0 | 2 | 0 | 2 | 0.49% |
| Indiana | 3 | 3 | 0 | 0 | 0 | 6 | 1.46% |
| Juniata | 0 | 0 | 1 | 0 | 0 | 1 | 0.24% |
| Lackawanna | 0 | 2 | 0 | 3 | 0 | 5 | 1.21% |
| Lancaster | 0 | 1 | 0 | 10 | 25 | 36 | 8.74% |
| Lebanon | 0 | 0 | 8 | 9 | 1 | 18 | 4.37% |
| Luzerne | 0 | 0 | 0 | 0 | 5 | 5 | 1.21% |
| Lycoming | 0 | 1 | 3 | 1 | 0 | 5 | 1.21% |
| McKean | 0 | 0 | 0 | 0 | 3 | 3 | 0.73% |
| Mifflin | 0 | 0 | 2 | 1 | 0 | 3 | 0.73% |
| Monroe | 2 | 2 | 1 | 5 | 1 | 11 | 2.67% |
| Montgomery | 0 | 1 | 0 | 3 | 11 | 15 | 3.64% |
| Northampton | 0 | 0 | 0 | 2 | 1 | 3 | 0.73% |
| Northumberland | 0 | 0 | 1 | 0 | 0 | 1 | 0.24% |
| Philadelphia | 0 | 0 | 0 | 4 | 3 | 7 | 1.70% |
| Potter | 0 | 1 | 0 | 1 | 1 | 3 | 0.73% |
| Schuylkill | 0 | 0 | 0 | 2 | 3 | 5 | 1.21% |
| Snyder | 0 | 0 | 0 | 1 | 0 | 1 | 0.24% |
| Somerset | 0 | 0 | 0 | 2 | 13 | 15 | 3.64% |
| Tioga | 0 | 0 | 0 | 1 | 0 | 1 | 0.24% |
| Venango | 0 | 1 | 0 | 2 | 0 | 3 | 0.73% |
| Warren | 0 | 0 | 0 | 1 | 0 | 1 | 0.24% |
| Washington | 2 | 0 | 0 | 1 | 3 | 6 | 1.46% |
| Wayne | 0 | 0 | 0 | 1 | 0 | 1 | 0.24% |
| Westmoreland | 0 | 12 | 3 | 0 | 11 | 26 | 6.31% |
| York | 1 | 2 | 10 | 5 | 24 | 42 | 10.19% |
| Grand Total | 15 | 49 | 54 | 89 | 205 | 412 | n/a |