
News
Pennsylvania retail theft offenses decreased over past five years

News Article
December 13, 2018
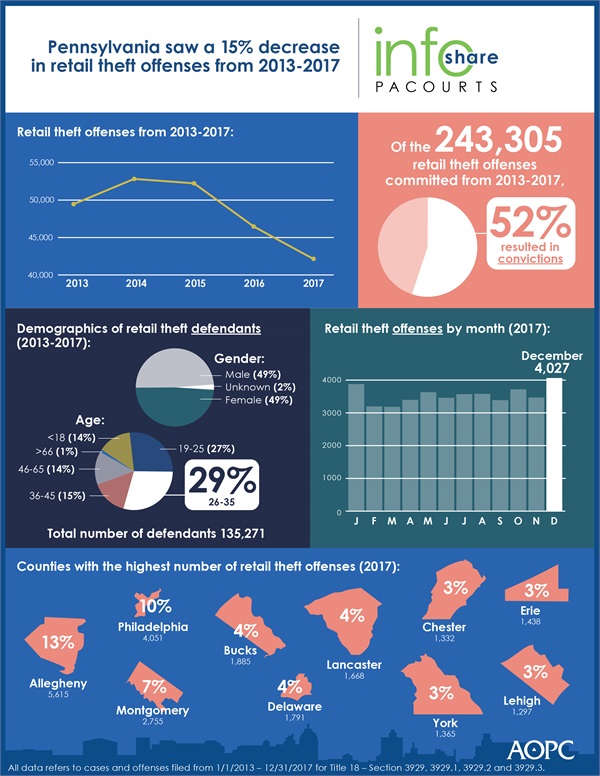
Pennsylvania retail theft offenses are at a five-year low, having decreased 15 percent since 2013.
The infographic highlights retail theft data from 2013 to 2017 including the statewide number of retail theft offenses by month, the top 10 counties with the highest number of retail theft offenses and statewide defendant demographics.
A high-resolution file of the graphic is available for download at www.pacourts.us under Media Resources. County numbers included at end of release.
PA Courts InfoShare is a monthly product of the Administrative Office of Pennsylvania Courts (AOPC) that visually highlights the work of the courts with interesting data and statistics obtained through the judiciary’s case management systems, interactive dashboards and other research. Reproduction is permissible with source cited.
##
Media contact: Kimberly Bathgate, 717-231-3331
Editor’s Note: County-by-county retail theft data including cases, offense counts by county below.
| Statewide number of offenses filed from 1/1/2013 through 12/31/2017 for Title 18 - Sections 3929, 3929.1, 3929.2, and 3929.3, as recorded in the Magisterial District Judge System (MDJS) and Common Pleas Case Management System (CPCMS); Grouped by County and Section | |||||||
| County / Section | 2013 | 2014 | 2015 | 2016 | 2017 | Total | Percentage of Total |
| Adams | 88 | 134 | 104 | 55 | 78 | 459 | 0.19% |
| 3929 | 88 | 134 | 104 | 55 | 78 | 459 | 0.19% |
| Allegheny | 5851 | 7266 | 7623 | 6770 | 5615 | 33125 | 13.61% |
| 3929 | 5847 | 7263 | 7571 | 6727 | 5566 | 32974 | 13.55% |
| 3929.1 | 1 | 1 | 3 | 1 |
| 6 | 0.00% |
| 3929.2 | 3 | 2 | 5 | 1 | 7 | 18 | 0.01% |
| 3929.3 |
|
| 44 | 41 | 42 | 127 | 0.05% |
| Armstrong | 131 | 185 | 170 | 114 | 126 | 726 | 0.30% |
| 3929 | 126 | 185 | 170 | 114 | 126 | 721 | 0.30% |
| 3929.1 | 5 |
|
|
|
| 5 | 0.00% |
| Beaver | 786 | 841 | 1097 | 812 | 880 | 4416 | 1.82% |
| 3929 | 786 | 841 | 1088 | 812 | 878 | 4405 | 1.81% |
| 3929.1 |
|
|
|
| 1 | 1 | 0.00% |
| 3929.3 |
|
| 9 |
| 1 | 10 | 0.00% |
| Bedford | 67 | 66 | 105 | 67 | 56 | 361 | 0.15% |
| 3929 | 67 | 66 | 105 | 67 | 56 | 361 | 0.15% |
| Berks | 1854 | 1809 | 1506 | 1202 | 1103 | 7474 | 3.07% |
| 3929 | 1849 | 1748 | 1501 | 1201 | 1099 | 7398 | 3.04% |
| 3929.1 |
| 31 | 1 |
|
| 32 | 0.01% |
| 3929.2 | 2 | 28 | 2 | 1 | 1 | 34 | 0.01% |
| 3929.3 | 3 | 2 | 2 |
| 3 | 10 | 0.00% |
| Blair | 717 | 699 | 803 | 584 | 599 | 3402 | 1.40% |
| 3929 | 716 | 699 | 803 | 584 | 599 | 3401 | 1.40% |
| 3929.2 | 1 |
|
|
|
| 1 | 0.00% |
| Bradford | 117 | 143 | 176 | 191 | 218 | 845 | 0.35% |
| 3929 | 117 | 143 | 176 | 191 | 218 | 845 | 0.35% |
| Bucks | 2210 | 2258 | 2465 | 2331 | 1885 | 11149 | 4.58% |
| 3929 | 2205 | 2252 | 2456 | 2312 | 1885 | 11110 | 4.57% |
| 3929.1 |
|
| 2 | 2 |
| 4 | 0.00% |
| 3929.2 | 1 | 4 | 1 | 6 |
| 12 | 0.00% |
| 3929.3 | 4 | 2 | 6 | 11 |
| 23 | 0.01% |
| Butler | 767 | 985 | 1108 | 931 | 853 | 4644 | 1.91% |
| 3929 | 738 | 964 | 1081 | 929 | 853 | 4565 | 1.88% |
| 3929.2 | 1 |
|
|
|
| 1 | 0.00% |
| 3929.3 | 28 | 21 | 27 | 2 |
| 78 | 0.03% |
| Cambria | 743 | 880 | 760 | 598 | 595 | 3576 | 1.47% |
| 3929 | 743 | 880 | 760 | 598 | 595 | 3576 | 1.47% |
| Cameron | 5 | 4 | 3 | 14 | 9 | 35 | 0.01% |
| 3929 | 5 | 4 | 3 | 14 | 9 | 35 | 0.01% |
| Carbon | 239 | 175 | 224 | 195 | 208 | 1041 | 0.43% |
| 3929 | 239 | 175 | 224 | 195 | 208 | 1041 | 0.43% |
| Centre | 428 | 331 | 331 | 226 | 264 | 1580 | 0.65% |
| 3929 | 418 | 331 | 331 | 226 | 264 | 1570 | 0.65% |
| 3929.3 | 10 |
|
|
|
| 10 | 0.00% |
| Chester | 1344 | 1875 | 1572 | 1739 | 1332 | 7862 | 3.23% |
| 3929 | 1331 | 1871 | 1570 | 1736 | 1319 | 7827 | 3.22% |
| 3929.1 |
|
|
| 1 | 1 | 2 | 0.00% |
| 3929.2 | 13 |
| 2 | 2 | 10 | 27 | 0.01% |
| 3929.3 |
| 4 |
|
| 2 | 6 | 0.00% |
| Clarion | 156 | 125 | 215 | 67 | 50 | 613 | 0.25% |
| 3929 | 156 | 125 | 215 | 67 | 50 | 613 | 0.25% |
| Clearfield | 355 | 274 | 272 | 228 | 273 | 1402 | 0.58% |
| 3929 | 355 | 273 | 270 | 228 | 273 | 1399 | 0.57% |
| 3929.1 |
| 1 |
|
|
| 1 | 0.00% |
| 3929.3 |
|
| 2 |
|
| 2 | 0.00% |
| Clinton | 129 | 160 | 142 | 121 | 83 | 635 | 0.26% |
| 3929 | 129 | 160 | 142 | 121 | 83 | 635 | 0.26% |
| Columbia | 145 | 241 | 210 | 155 | 196 | 947 | 0.39% |
| 3929 | 145 | 241 | 210 | 155 | 196 | 947 | 0.39% |
| Crawford | 229 | 229 | 171 | 138 | 125 | 892 | 0.37% |
| 3929 | 229 | 229 | 171 | 138 | 125 | 892 | 0.37% |
| Cumberland | 1166 | 1367 | 1125 | 1195 | 1019 | 5872 | 2.41% |
| 3929 | 1166 | 1367 | 1123 | 1195 | 1019 | 5870 | 2.41% |
| 3929.1 |
|
| 1 |
|
| 1 | 0.00% |
| 3929.3 |
|
| 1 |
|
| 1 | 0.00% |
| Dauphin | 1346 | 1564 | 1279 | 1093 | 1344 | 6626 | 2.72% |
| 3929 | 1346 | 1555 | 1278 | 1085 | 1341 | 6605 | 2.71% |
| 3929.1 |
|
|
| 1 |
| 1 | 0.00% |
| 3929.2 |
| 1 | 1 | 6 | 3 | 11 | 0.00% |
| 3929.3 |
| 8 |
| 1 |
| 9 | 0.00% |
| Delaware | 2250 | 2112 | 2017 | 1904 | 1791 | 10074 | 4.14% |
| 3929 | 2246 | 2103 | 1996 | 1898 | 1767 | 10010 | 4.11% |
| 3929.1 | 2 |
|
|
|
| 2 | 0.00% |
| 3929.2 | 1 | 1 | 12 | 6 | 24 | 44 | 0.02% |
| 3929.3 | 1 | 8 | 9 |
|
| 18 | 0.01% |
| Elk | 200 | 147 | 44 | 84 | 159 | 634 | 0.26% |
| 3929 | 200 | 147 | 44 | 84 | 159 | 634 | 0.26% |
| Erie | 1274 | 1647 | 2080 | 1560 | 1438 | 7999 | 3.29% |
| 3929 | 1273 | 1647 | 2080 | 1560 | 1436 | 7996 | 3.29% |
| 3929.1 |
|
|
|
| 2 | 2 | 0.00% |
| 3929.2 | 1 |
|
|
|
| 1 | 0.00% |
| Fayette | 763 | 507 | 487 | 417 | 593 | 2767 | 1.14% |
| 3929 | 763 | 507 | 487 | 417 | 593 | 2767 | 1.14% |
| Forest | 2 | 3 |
| 1 | 1 | 7 | 0.00% |
| 3929 | 2 | 3 |
| 1 | 1 | 7 | 0.00% |
| Franklin | 633 | 913 | 651 | 566 | 491 | 3254 | 1.34% |
| 3929 | 632 | 912 | 650 | 565 | 491 | 3250 | 1.34% |
| 3929.1 | 1 |
| 1 | 1 |
| 3 | 0.00% |
| 3929.2 |
| 1 |
|
|
| 1 | 0.00% |
| Fulton | 21 | 6 | 13 | 16 | 10 | 66 | 0.03% |
| 3929 | 21 | 6 | 13 | 16 | 10 | 66 | 0.03% |
| Greene | 51 | 49 | 100 | 56 | 35 | 291 | 0.12% |
| 3929 | 51 | 49 | 100 | 56 | 35 | 291 | 0.12% |
| Huntingdon | 85 | 117 | 92 | 63 | 45 | 402 | 0.17% |
| 3929 | 85 | 117 | 92 | 63 | 45 | 402 | 0.17% |
| Indiana | 370 | 413 | 351 | 427 | 256 | 1817 | 0.75% |
| 3929 | 370 | 413 | 351 | 427 | 256 | 1817 | 0.75% |
| Jefferson | 207 | 76 | 89 | 50 | 129 | 551 | 0.23% |
| 3929 | 207 | 76 | 89 | 50 | 128 | 550 | 0.23% |
| 3929.1 |
|
|
|
| 1 | 1 | 0.00% |
| Juniata | 11 | 7 | 6 | 10 | 11 | 45 | 0.02% |
| 3929 | 11 | 7 | 6 | 10 | 11 | 45 | 0.02% |
| Lackawanna | 685 | 772 | 754 | 705 | 602 | 3518 | 1.45% |
| 3929 | 685 | 772 | 754 | 705 | 601 | 3517 | 1.45% |
| 3929.2 |
|
|
|
| 1 | 1 | 0.00% |
| Lancaster | 1823 | 1756 | 1590 | 1602 | 1668 | 8439 | 3.47% |
| 3929 | 1823 | 1756 | 1586 | 1594 | 1660 | 8419 | 3.46% |
| 3929.1 |
|
|
| 1 |
| 1 | 0.00% |
| 3929.2 |
|
| 4 |
|
| 4 | 0.00% |
| 3929.3 |
|
|
| 7 | 8 | 15 | 0.01% |
| Lawrence | 453 | 525 | 417 | 266 | 273 | 1934 | 0.79% |
| 3929 | 453 | 525 | 417 | 266 | 273 | 1934 | 0.79% |
| Lebanon | 506 | 696 | 577 | 462 | 470 | 2711 | 1.11% |
| 3929 | 506 | 696 | 571 | 462 | 470 | 2705 | 1.11% |
| 3929.3 |
|
| 6 |
|
| 6 | 0.00% |
| Lehigh | 1836 | 1673 | 1506 | 1373 | 1297 | 7685 | 3.16% |
| 3929 | 1832 | 1669 | 1506 | 1372 | 1297 | 7676 | 3.15% |
| 3929.1 |
|
|
| 1 |
| 1 | 0.00% |
| 3929.3 | 4 | 4 |
|
|
| 8 | 0.00% |
| Luzerne | 1551 | 1533 | 1439 | 1264 | 1130 | 6917 | 2.84% |
| 3929 | 1550 | 1533 | 1439 | 1264 | 1130 | 6916 | 2.84% |
| 3929.1 | 1 |
|
|
|
| 1 | 0.00% |
| Lycoming | 499 | 503 | 381 | 370 | 393 | 2146 | 0.88% |
| 3929 | 499 | 503 | 381 | 369 | 393 | 2145 | 0.88% |
| 3929.3 |
|
|
| 1 |
| 1 | 0.00% |
| McKean | 79 | 102 | 82 | 111 | 142 | 516 | 0.21% |
| 3929 | 79 | 102 | 82 | 111 | 142 | 516 | 0.21% |
| Mercer | 838 | 611 | 466 | 518 | 665 | 3098 | 1.27% |
| 3929 | 837 | 598 | 466 | 518 | 665 | 3084 | 1.27% |
| 3929.2 | 1 |
|
|
|
| 1 | 0.00% |
| 3929.3 |
| 13 |
|
|
| 13 | 0.01% |
| Mifflin | 113 | 117 | 150 | 140 | 77 | 597 | 0.25% |
| 3929 | 113 | 117 | 150 | 140 | 77 | 597 | 0.25% |
| Monroe | 1047 | 955 | 1109 | 723 | 922 | 4756 | 1.95% |
| 3929 | 1041 | 952 | 1109 | 723 | 921 | 4746 | 1.95% |
| 3929.2 |
|
|
|
| 1 | 1 | 0.00% |
| 3929.3 | 6 | 3 |
|
|
| 9 | 0.00% |
| Montgomery | 3308 | 3713 | 4223 | 3379 | 2755 | 17378 | 7.14% |
| 3929 | 3196 | 3648 | 4118 | 3309 | 2727 | 16998 | 6.99% |
| 3929.1 | 1 |
|
|
|
| 1 | 0.00% |
| 3929.2 | 110 | 56 | 86 | 63 | 26 | 341 | 0.14% |
| 3929.3 | 1 | 9 | 19 | 7 | 2 | 38 | 0.02% |
| Montour | 10 | 25 | 15 | 42 | 18 | 110 | 0.05% |
| 3929 | 10 | 25 | 15 | 42 | 18 | 110 | 0.05% |
| Northampton | 813 | 782 | 644 | 719 | 609 | 3567 | 1.47% |
| 3929 | 807 | 782 | 643 | 719 | 609 | 3560 | 1.46% |
| 3929.1 | 1 |
|
|
|
| 1 | 0.00% |
| 3929.2 |
|
| 1 |
|
| 1 | 0.00% |
| 3929.3 | 5 |
|
|
|
| 5 | 0.00% |
| Northumberland | 204 | 313 | 222 | 304 | 173 | 1216 | 0.50% |
| 3929 | 204 | 313 | 222 | 304 | 173 | 1216 | 0.50% |
| Perry | 30 | 20 | 35 | 23 | 22 | 130 | 0.05% |
| 3929 | 30 | 20 | 35 | 19 | 22 | 126 | 0.05% |
| 3929.2 |
|
|
| 4 |
| 4 | 0.00% |
| Philadelphia | 5340 | 4957 | 4716 | 4532 | 4051 | 23596 | 9.70% |
| 3929 | 5334 | 4957 | 4683 | 4518 | 4030 | 23522 | 9.67% |
| 3929.1 |
|
|
|
| 1 | 1 | 0.00% |
| 3929.2 | 3 |
| 6 | 7 | 2 | 18 | 0.01% |
| 3929.3 | 3 |
| 27 | 7 | 18 | 55 | 0.02% |
| Pike | 120 | 166 | 133 | 71 | 68 | 558 | 0.23% |
| 3929 | 120 | 166 | 133 | 71 | 68 | 558 | 0.23% |
| Potter | 9 | 5 | 1 | 7 | 15 | 37 | 0.02% |
| 3929 | 9 | 5 | 1 | 7 | 15 | 37 | 0.02% |
| Schuylkill | 450 | 513 | 477 | 492 | 591 | 2523 | 1.04% |
| 3929 | 450 | 513 | 477 | 488 | 591 | 2519 | 1.04% |
| 3929.1 |
|
|
| 4 |
| 4 | 0.00% |
| Snyder | 166 | 328 | 249 | 259 | 190 | 1192 | 0.49% |
| 3929 | 166 | 328 | 249 | 259 | 190 | 1192 | 0.49% |
| Somerset | 135 | 137 | 231 | 233 | 104 | 840 | 0.35% |
| 3929 | 135 | 137 | 231 | 193 | 104 | 800 | 0.33% |
| 3929.3 |
|
|
| 40 |
| 40 | 0.02% |
| Sullivan |
|
|
| 2 | 1 | 3 | 0.00% |
| 3929 |
|
|
| 2 | 1 | 3 | 0.00% |
| Susquehanna | 25 | 37 | 40 | 31 | 31 | 164 | 0.07% |
| 3929 | 25 | 37 | 40 | 31 | 31 | 164 | 0.07% |
| Tioga | 128 | 68 | 115 | 125 | 64 | 500 | 0.21% |
| 3929 | 128 | 68 | 115 | 125 | 64 | 500 | 0.21% |
| Union | 144 | 185 | 218 | 130 | 204 | 881 | 0.36% |
| 3929 | 144 | 185 | 218 | 130 | 204 | 881 | 0.36% |
| Venango | 172 | 149 | 143 | 126 | 132 | 722 | 0.30% |
| 3929 | 172 | 149 | 143 | 126 | 132 | 722 | 0.30% |
| Warren | 152 | 69 | 305 | 168 | 103 | 797 | 0.33% |
| 3929 | 152 | 69 | 305 | 164 | 103 | 793 | 0.33% |
| 3929.1 |
|
|
| 1 |
| 1 | 0.00% |
| 3929.3 |
|
|
| 3 |
| 3 | 0.00% |
| Washington | 657 | 828 | 904 | 859 | 734 | 3982 | 1.64% |
| 3929 | 657 | 827 | 904 | 859 | 733 | 3980 | 1.64% |
| 3929.1 |
|
|
|
| 1 | 1 | 0.00% |
| 3929.2 |
| 1 |
|
|
| 1 | 0.00% |
| Wayne | 92 | 109 | 116 | 99 | 67 | 483 | 0.20% |
| 3929 | 92 | 109 | 116 | 98 | 67 | 482 | 0.20% |
| 3929.2 |
|
|
| 1 |
| 1 | 0.00% |
| Westmoreland | 1570 | 1814 | 1481 | 1457 | 1302 | 7624 | 3.13% |
| 3929 | 1563 | 1814 | 1481 | 1457 | 1300 | 7615 | 3.13% |
| 3929.1 | 7 |
|
|
|
| 7 | 0.00% |
| 3929.2 |
|
|
|
| 2 | 2 | 0.00% |
| Wyoming | 105 | 71 | 99 | 101 | 50 | 426 | 0.18% |
| 3929 | 105 | 71 | 99 | 101 | 50 | 426 | 0.18% |
| York | 1712 | 1733 | 2054 | 1806 | 1365 | 8670 | 3.56% |
| 3929 | 1702 | 1733 | 2053 | 1697 | 1354 | 8539 | 3.51% |
| 3929.3 | 10 |
| 1 | 109 | 11 | 131 | 0.05% |
| Grand Total | 49512 | 52873 | 52283 | 46479 | 42158 | 243305 | 100.00% |