Pennsylvania identity theft case trends
News Article
June 07, 2019
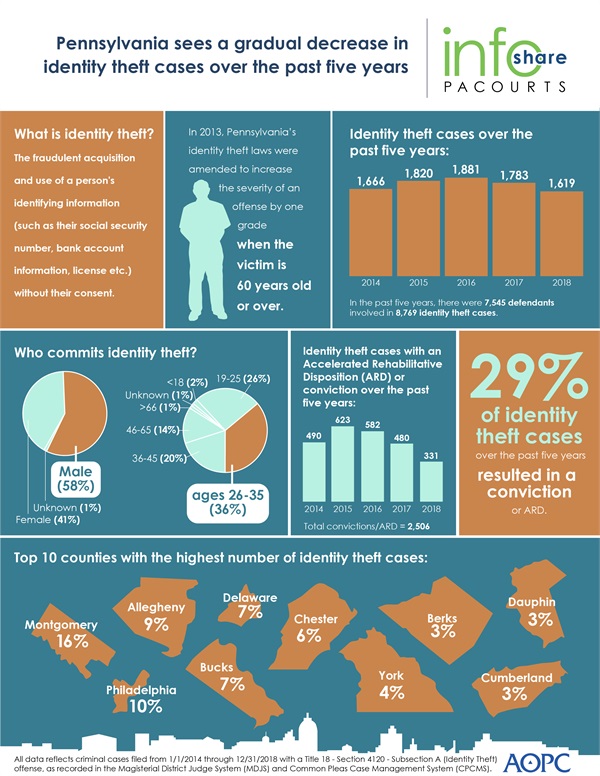
Over the last five years, Pennsylvania has seen a gradual decrease in identity theft cases. Identity theft is defined as the fraudulent use of another person’s identifying information (social security number, bank account, birth certificate etc.).
The infographic below highlights key data including defendant demographics, identity theft case counts and outcomes as well as county-level data where identity theft is most prevalent (also see editor’s note).
A high-resolution file of the graphic is available for download at www.pacourts.us under Media Resources.
PA Courts InfoShare is a monthly product of the Administrative Office of Pennsylvania Courts (AOPC) that visually highlights the work of the courts with interesting data and statistics obtained through the judiciary’s case management systems, interactive dashboards and other research. Reproduction is encouraged with source cited.
##
Media contact: Kim Bathgate, 717-231-3331
Editor’s note:
| Statewide number of criminal cases filed from 1/1/2014 through 12/31/2018 with a Title 18 - Section 4120 - Subsection A (Identity Theft) offense, as recorded in the Magisterial District Judge System (MDJS) and Common Pleas Case Management System (CPCMS) | | County | 2014 | 2015 | 2016 | 2017 | 2018 | Total | Percentage of Total | | Adams | 8 | 6 | 8 | 8 | 8 | 38 | 0.43% | | Allegheny | 150 | 188 | 147 | 137 | 152 | 774 | 8.83% | | Armstrong | 1 | 5 | 12 | 1 | 2 | 21 | 0.24% | | Beaver | 15 | 31 | 7 | 12 | 19 | 84 | 0.96% | | Bedford | 3 | 4 | 5 | 6 | 2 | 20 | 0.23% | | Berks | 57 | 46 | 70 | 59 | 64 | 296 | 3.38% | | Blair | 21 | 21 | 18 | 16 | 13 | 89 | 1.01% | | Bradford | 6 | 4 | 3 | 3 | 2 | 18 | 0.21% | | Bucks | 115 | 135 | 127 | 147 | 111 | 635 | 7.24% | | Butler | 34 | 28 | 45 | 27 | 11 | 145 | 1.65% | | Cambria | 16 | 17 | 13 | 11 | 2 | 59 | 0.67% | | Cameron | 0 | 0 | 0 | 0 | 3 | 3 | 0.03% | | Carbon | 13 | 12 | 5 | 22 | 9 | 61 | 0.70% | | Centre | 15 | 41 | 7 | 19 | 14 | 96 | 1.09% | | Chester | 76 | 100 | 158 | 96 | 125 | 555 | 6.33% | | Clarion | 3 | 4 | 4 | 1 | 4 | 16 | 0.18% | | Clearfield | 1 | 1 | 2 | 1 | 2 | 7 | 0.08% | | Clinton | 0 | 0 | 4 | 3 | 2 | 9 | 0.10% | | Columbia | 8 | 9 | 10 | 6 | 3 | 36 | 0.41% | | Crawford | 4 | 8 | 12 | 6 | 5 | 35 | 0.40% | | Cumberland | 42 | 46 | 36 | 57 | 40 | 221 | 2.52% | | Dauphin | 50 | 53 | 39 | 65 | 50 | 257 | 2.93% | | Delaware | 125 | 137 | 121 | 123 | 113 | 619 | 7.06% | | Elk | 2 | 1 | 5 | 2 | 1 | 11 | 0.13% | | Erie | 25 | 23 | 19 | 13 | 15 | 95 | 1.08% | | Fayette | 9 | 9 | 13 | 12 | 4 | 47 | 0.54% | | Forest | 0 | 1 | 0 | 0 | 0 | 1 | 0.01% | | Franklin | 27 | 18 | 27 | 20 | 15 | 107 | 1.22% | | Fulton | 0 | 4 | 4 | 1 | 2 | 11 | 0.13% | | Greene | 4 | 7 | 5 | 9 | 0 | 25 | 0.29% | | Huntingdon | 4 | 5 | 6 | 2 | 3 | 20 | 0.23% | | Indiana | 3 | 6 | 2 | 9 | 10 | 30 | 0.34% | | Jefferson | 3 | 5 | 3 | 9 | 7 | 27 | 0.31% | | Juniata | 2 | 0 | 0 | 2 | 2 | 6 | 0.07% | | Lackawanna | 16 | 19 | 12 | 25 | 19 | 91 | 1.04% | | Lancaster | 24 | 31 | 26 | 27 | 33 | 141 | 1.61% | | Lawrence | 7 | 5 | 6 | 4 | 6 | 28 | 0.32% | | Lebanon | 25 | 15 | 27 | 16 | 19 | 102 | 1.16% | | Lehigh | 20 | 32 | 29 | 35 | 23 | 139 | 1.59% | | Luzerne | 35 | 17 | 18 | 22 | 28 | 120 | 1.37% | | Lycoming | 15 | 12 | 24 | 8 | 11 | 70 | 0.80% | | McKean | 3 | 4 | 1 | 2 | 2 | 12 | 0.14% | | Mercer | 15 | 10 | 28 | 10 | 11 | 74 | 0.84% | | Mifflin | 1 | 1 | 0 | 0 | 0 | 2 | 0.02% | | Monroe | 15 | 11 | 15 | 22 | 19 | 82 | 0.94% | | Montgomery | 257 | 262 | 302 | 311 | 259 | 1,391 | 15.86% | | Montour | 3 | 3 | 2 | 1 | 2 | 11 | 0.13% | | Northampton | 21 | 19 | 39 | 31 | 43 | 153 | 1.74% | | Northumberland | 5 | 16 | 11 | 9 | 13 | 54 | 0.62% | | Perry | 5 | 5 | 6 | 3 | 3 | 22 | 0.25% | | Philadelphia | 176 | 181 | 203 | 165 | 120 | 845 | 9.64% | | Pike | 4 | 4 | 6 | 7 | 8 | 29 | 0.33% | | Potter | 1 | 5 | 1 | 1 | 2 | 10 | 0.11% | | Schuylkill | 22 | 16 | 16 | 23 | 12 | 89 | 1.01% | | Snyder | 2 | 1 | 1 | 6 | 4 | 14 | 0.16% | | Somerset | 9 | 4 | 4 | 3 | 7 | 27 | 0.31% | | Susquehanna | 0 | 4 | 2 | 3 | 4 | 13 | 0.15% | | Tioga | 4 | 3 | 5 | 3 | 2 | 17 | 0.19% | | Union | 0 | 0 | 4 | 0 | 11 | 15 | 0.17% | | Venango | 9 | 10 | 13 | 15 | 9 | 56 | 0.64% | | Warren | 11 | 3 | 7 | 3 | 0 | 24 | 0.27% | | Washington | 18 | 24 | 25 | 10 | 20 | 97 | 1.11% | | Wayne | 8 | 4 | 3 | 5 | 1 | 21 | 0.24% | | Westmoreland | 34 | 49 | 51 | 40 | 43 | 217 | 2.47% | | Wyoming | 7 | 3 | 1 | 3 | 3 | 17 | 0.19% | | York | 52 | 72 | 56 | 65 | 67 | 312 | 3.56% | | Grand Total | 1,666 | 1,820 | 1,881 | 1,783 | 1,619 | 8,769 | N/A | |
| Total cases with an ARD or Conviction | 2014 | 2015 | 2016 | 2017 | 2018 | Total |
| ARD Only | 110 | 140 | 97 | 98 | 80 | 525 |
| Convictions Only | 380 | 483 | 485 | 382 | 251 | 1,981 |
| Total: ARD + Convictions | 490 | 623 | 582 | 480 | 331 | 2,506 |
| Percentage of cases with an ARD or Conviction | 2014 | 2015 | 2016 | 2017 | 2018 | Total |
| ARD Only | 6.60% | 7.69% | 5.16% | 5.50% | 4.94% | 5.99% |
| Convictions Only | 22.81% | 26.54% | 25.78% | 21.42% | 15.50% | 22.59% |
| Total: ARD + Convictions | 29.41% | 34.23% | 30.94% | 26.92% | 20.44% | 28.58% |