
News
A snapshot of sexual offenders in Pennsylvania

August 23, 2019
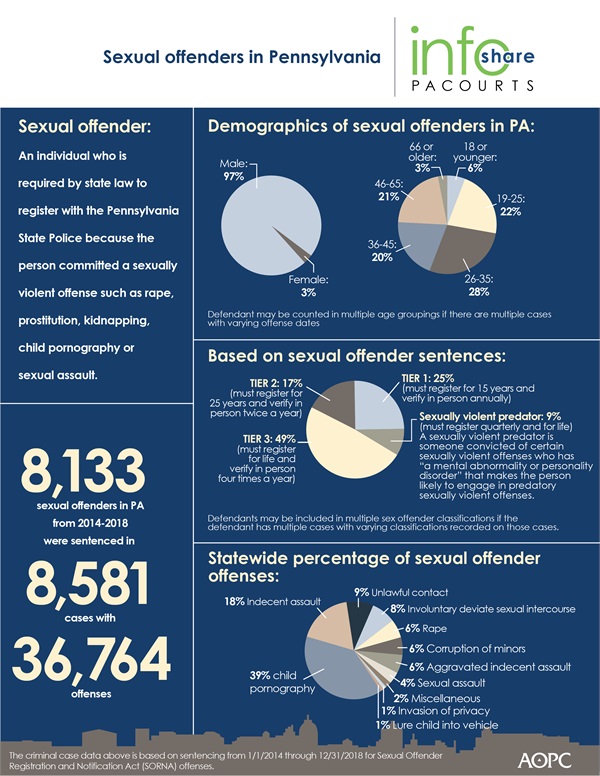
Under Pennsylvania’s Sexual Offender Registration and Notification Act (SORNA), 8,133 people were sentenced as sexual offenders between 2014 to 2018, and were charged with 36,764 offenses. Of those sexual offenders who were sentenced, 50% were between the ages of 19-35, and 39% were charged with child pornography.
The infographic below highlights key data and demographics about sexual offenders in Pennsylvania. Download a high-resolution version of the graphic.
PA Courts InfoShare is a monthly product of the Administrative Office of Pennsylvania Courts (AOPC) that visually highlights the work of the courts with interesting data and statistics obtained through the judiciary’s case management systems, interactive dashboards and other research. Reproduction is permissible with source cited.
Editor’s Note:
| County-level numbers of criminal cases sentenced from 1/1/2014 through 12/31/2018 for a SORNA offense; Grouped by County | |||||||
| County | 2014 | 2015 | 2016 | 2017 | 2018 | Grand Total | Percentage of Total |
| Adams | 9 | 17 | 20 | 27 | 16 | 89 | 1.04% |
| Allegheny | 141 | 144 | 156 | 130 | 170 | 741 | 8.64% |
| Armstrong | 4 | 10 | 8 | 7 | 10 | 39 | 0.45% |
| Beaver | 13 | 13 | 14 | 21 | 19 | 80 | 0.93% |
| Bedford | 5 | 12 | 12 | 10 | 18 | 57 | 0.66% |
| Berks | 44 | 57 | 51 | 53 | 42 | 247 | 2.88% |
| Blair | 20 | 23 | 28 | 21 | 22 | 114 | 1.33% |
| Bradford | 21 | 17 | 10 | 13 | 16 | 77 | 0.90% |
| Bucks | 40 | 52 | 40 | 64 | 45 | 241 | 2.81% |
| Butler | 16 | 14 | 14 | 6 | 11 | 61 | 0.71% |
| Cambria | 22 | 12 | 19 | 15 | 21 | 89 | 1.04% |
| Cameron | 0 | 2 | 3 | 1 | 2 | 8 | 0.09% |
| Carbon | 9 | 12 | 20 | 20 | 12 | 73 | 0.85% |
| Centre | 10 | 22 | 17 | 12 | 20 | 81 | 0.94% |
| Chester | 29 | 41 | 52 | 57 | 55 | 234 | 2.73% |
| Clarion | 5 | 3 | 8 | 7 | 13 | 36 | 0.42% |
| Clearfield | 10 | 8 | 13 | 10 | 9 | 50 | 0.58% |
| Clinton | 4 | 11 | 2 | 6 | 8 | 31 | 0.36% |
| Columbia | 7 | 4 | 8 | 12 | 2 | 33 | 0.38% |
| Crawford | 15 | 17 | 22 | 16 | 20 | 90 | 1.05% |
| Cumberland | 30 | 32 | 30 | 27 | 32 | 151 | 1.76% |
| Dauphin | 60 | 54 | 64 | 69 | 80 | 327 | 3.81% |
| Delaware | 75 | 76 | 57 | 73 | 60 | 341 | 3.97% |
| Elk | 4 | 5 | 1 | 4 | 4 | 18 | 0.21% |
| Erie | 44 | 29 | 32 | 32 | 35 | 172 | 2.00% |
| Fayette | 46 | 19 | 12 | 29 | 24 | 130 | 1.51% |
| Forest | 1 | 2 | 0 | 1 | 2 | 6 | 0.07% |
| Franklin | 23 | 31 | 27 | 32 | 31 | 144 | 1.68% |
| Fulton | 2 | 8 | 2 | 4 | 3 | 19 | 0.22% |
| Greene | 6 | 5 | 18 | 6 | 1 | 36 | 0.42% |
| Huntingdon | 8 | 9 | 10 | 8 | 14 | 49 | 0.57% |
| Indiana | 12 | 12 | 6 | 9 | 12 | 51 | 0.59% |
| Jefferson | 7 | 8 | 13 | 14 | 12 | 54 | 0.63% |
| Juniata | 3 | 4 | 8 | 2 | 6 | 23 | 0.27% |
| Lackawanna | 20 | 32 | 26 | 38 | 26 | 142 | 1.65% |
| Lancaster | 56 | 76 | 131 | 100 | 94 | 457 | 5.33% |
| Lawrence | 9 | 6 | 12 | 7 | 17 | 51 | 0.59% |
| Lebanon | 26 | 35 | 38 | 26 | 32 | 157 | 1.83% |
| Lehigh | 16 | 26 | 19 | 29 | 24 | 114 | 1.33% |
| Luzerne | 39 | 48 | 38 | 40 | 60 | 225 | 2.62% |
| Lycoming | 12 | 15 | 20 | 13 | 15 | 75 | 0.87% |
| McKean | 16 | 4 | 6 | 13 | 4 | 43 | 0.50% |
| Mercer | 19 | 18 | 18 | 30 | 33 | 118 | 1.38% |
| Mifflin | 5 | 5 | 2 | 15 | 8 | 35 | 0.41% |
| Monroe | 31 | 26 | 33 | 29 | 25 | 144 | 1.68% |
| Montgomery | 51 | 67 | 77 | 71 | 74 | 340 | 3.96% |
| Montour | 0 | 2 | 3 | 2 | 6 | 13 | 0.15% |
| Northampton | 22 | 22 | 27 | 39 | 29 | 139 | 1.62% |
| Northumberland | 8 | 29 | 7 | 18 | 10 | 72 | 0.84% |
| Perry | 11 | 5 | 5 | 9 | 7 | 37 | 0.43% |
| Philadelphia | 230 | 210 | 219 | 312 | 339 | 1,310 | 15.27% |
| Pike | 7 | 7 | 3 | 6 | 6 | 29 | 0.34% |
| Potter | 7 | 5 | 9 | 0 | 7 | 28 | 0.33% |
| Schuylkill | 10 | 26 | 10 | 21 | 18 | 85 | 0.99% |
| Snyder | 4 | 3 | 3 | 2 | 7 | 19 | 0.22% |
| Somerset | 11 | 9 | 8 | 3 | 10 | 41 | 0.48% |
| Sullivan | 0 | 0 | 1 | 0 | 0 | 1 | 0.01% |
| Susquehanna | 10 | 5 | 4 | 2 | 3 | 24 | 0.28% |
| Tioga | 6 | 5 | 2 | 4 | 12 | 29 | 0.34% |
| Union | 4 | 4 | 11 | 5 | 4 | 28 | 0.33% |
| Venango | 6 | 10 | 13 | 14 | 16 | 59 | 0.69% |
| Warren | 13 | 13 | 9 | 9 | 7 | 51 | 0.59% |
| Washington | 12 | 37 | 20 | 16 | 26 | 111 | 1.29% |
| Wayne | 5 | 8 | 4 | 8 | 5 | 30 | 0.35% |
| Westmoreland | 29 | 37 | 35 | 75 | 40 | 216 | 2.52% |
| Wyoming | 4 | 3 | 12 | 3 | 6 | 28 | 0.33% |
| York | 52 | 49 | 79 | 77 | 81 | 338 | 3.94% |
| Grand Total | 1,496 | 1,632 | 1,701 | 1,854 | 1,898 | 8,581 |
|