
News
Distracted-driving citations in Pennsylvania

April 01, 2021
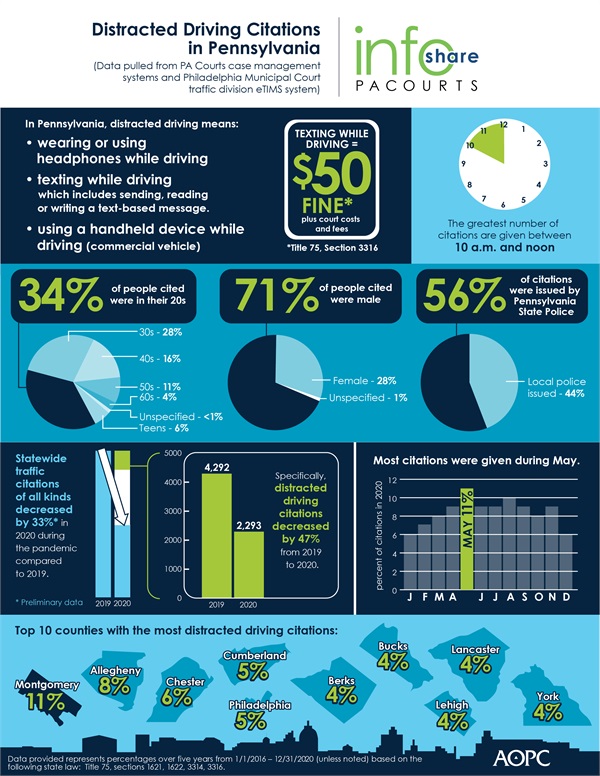
Overall traffic citations in Pennsylvania decreased by 33 percent in 2020 during the pandemic compared to 2019. Specifically, distracted-driving citations decreased by 47 percent statewide from 2019 to 2020.
Distracted-driving citations in Pennsylvania can be issued for 1) using headphones while driving, 2) using a handheld mobile phone while driving a commercial vehicle or 3) texting while driving. Texting includes sending, reading or writing a text-based message.
The infographic below highlights key data and demographics about distracted drivers in Pennsylvania over the last five years. Detailed county data is available here. A high-resolution file of the graphic is available for download at www.pacourts.us under Media Resources.
PA Courts InfoShare is a monthly product of the Administrative Office of Pennsylvania Courts (AOPC) that visually highlights the work of the courts with interesting data and statistics obtained through the judiciary’s case management systems, interactive dashboards and other research. Reproduction is permissible with source cited.
##
Media contact: Kimberly Bathgate, 717-231-3331
Editor’s Note:
| Statewide Count of distracted driving offenses filed from 1/1/2016 through 12/31/2020; Grouped by County |
| County | 2016 | 2017 | 2018 | 2019 | 2020 | Total | Percentage of Total |
| Adams | 26 | 45 | 57 | 55 | 37 | 220 | 1.11% |
| Allegheny | 316 | 383 | 384 | 273 | 197 | 1,553 | 7.86% |
| Armstrong | 7 | 13 | 9 | 17 | 8 | 54 | 0.27% |
| Beaver | 12 | 38 | 32 | 22 | 15 | 119 | 0.60% |
| Bedford | 26 | 28 | 41 | 24 | 17 | 136 | 0.69% |
| Berks | 117 | 198 | 189 | 199 | 103 | 806 | 4.08% |
| Blair | 34 | 18 | 22 | 25 | 16 | 115 | 0.58% |
| Bradford | 12 | 11 | 6 | 10 | 5 | 44 | 0.22% |
| Bucks | 152 | 294 | 217 | 139 | 60 | 862 | 4.36% |
| Butler | 45 | 51 | 46 | 50 | 35 | 227 | 1.15% |
| Cambria | 17 | 15 | 18 | 34 | 12 | 96 | 0.49% |
| Cameron | 3 | 2 | 4 | 1 | 1 | 11 | 0.06% |
| Carbon | 19 | 30 | 28 | 30 | 18 | 125 | 0.63% |
| Centre | 29 | 39 | 42 | 17 | 13 | 140 | 0.71% |
| Chester | 208 | 339 | 272 | 216 | 116 | 1,151 | 5.82% |
| Clarion | 15 | 42 | 27 | 23 | 16 | 123 | 0.62% |
| Clearfield | 16 | 17 | 16 | 10 | 22 | 81 | 0.41% |
| Clinton | 12 | 31 | 13 | 31 | 12 | 99 | 0.50% |
| Columbia | 36 | 59 | 89 | 51 | 37 | 272 | 1.38% |
| Crawford | 21 | 22 | 20 | 22 | 38 | 123 | 0.62% |
| Cumberland | 179 | 220 | 189 | 261 | 113 | 962 | 4.87% |
| Dauphin | 70 | 86 | 127 | 155 | 106 | 544 | 2.75% |
| Delaware | 127 | 208 | 157 | 177 | 80 | 749 | 3.79% |
| Elk | 2 | 11 | 53 | 16 | 4 | 86 | 0.44% |
| Erie | 32 | 74 | 56 | 43 | 37 | 242 | 1.22% |
| Fayette | 13 | 34 | 33 | 27 | 16 | 123 | 0.62% |
| Forest | 1 | 4 | 4 | 5 | 4 | 18 | 0.09% |
| Franklin | 46 | 72 | 57 | 71 | 59 | 305 | 1.54% |
| Fulton | 7 | 10 | 15 | 11 | 6 | 49 | 0.25% |
| Greene | 8 | 11 | 12 | 8 | 1 | 40 | 0.20% |
| Huntingdon | 12 | 13 | 8 | 3 | 2 | 38 | 0.19% |
| Indiana | 22 | 23 | 24 | 18 | 5 | 92 | 0.47% |
| Jefferson | 8 | 42 | 17 | 27 | 35 | 129 | 0.65% |
| Juniata | 9 | 7 | 15 | 16 | 8 | 55 | 0.28% |
| Lackawanna | 86 | 121 | 102 | 99 | 47 | 455 | 2.30% |
| Lancaster | 116 | 244 | 214 | 174 | 82 | 830 | 4.20% |
| Lawrence | 12 | 42 | 30 | 19 | 8 | 111 | 0.56% |
| Lebanon | 28 | 49 | 105 | 93 | 26 | 301 | 1.52% |
| Lehigh | 93 | 220 | 163 | 201 | 90 | 767 | 3.88% |
| Luzerne | 53 | 84 | 107 | 122 | 83 | 449 | 2.27% |
| Lycoming | 18 | 27 | 33 | 40 | 15 | 133 | 0.67% |
| McKean | 2 | 6 | 14 | 12 | 7 | 41 | 0.21% |
| Mercer | 17 | 33 | 45 | 39 | 27 | 161 | 0.81% |
| Mifflin | 8 | 7 | 4 | 4 | 2 | 25 | 0.13% |
| Monroe | 63 | 45 | 60 | 77 | 46 | 291 | 1.47% |
| Montgomery | 379 | 620 | 577 | 443 | 188 | 2,207 | 11.16% |
| Montour | 1 | 5 | 3 | 8 | 0 | 17 | 0.09% |
| Northampton | 78 | 219 | 149 | 110 | 51 | 607 | 3.07% |
| Northumberland | 21 | 23 | 23 | 16 | 22 | 105 | 0.53% |
| Perry | 4 | 17 | 22 | 12 | 6 | 61 | 0.31% |
| Philadelphia | 216 | 216 | 255 | 211 | 74 | 972 | 4.92% |
| Pike | 16 | 23 | 11 | 18 | 11 | 79 | 0.40% |
| Potter | 17 | 28 | 22 | 9 | 2 | 78 | 0.39% |
| Schuylkill | 22 | 31 | 34 | 41 | 14 | 142 | 0.72% |
| Snyder | 19 | 30 | 25 | 26 | 13 | 113 | 0.57% |
| Somerset | 6 | 28 | 42 | 29 | 16 | 121 | 0.61% |
| Sullivan | 4 | 3 | 0 | 1 | 2 | 10 | 0.05% |
| Susquehanna | 15 | 37 | 40 | 21 | 14 | 127 | 0.64% |
| Tioga | 6 | 11 | 11 | 15 | 3 | 46 | 0.23% |
| Union | 8 | 6 | 12 | 13 | 5 | 44 | 0.22% |
| Venango | 7 | 21 | 27 | 45 | 22 | 122 | 0.62% |
| Warren | 8 | 5 | 7 | 2 | 3 | 25 | 0.13% |
| Washington | 58 | 79 | 83 | 62 | 34 | 316 | 1.60% |
| Wayne | 7 | 9 | 7 | 7 | 5 | 35 | 0.18% |
| Westmoreland | 71 | 74 | 81 | 78 | 39 | 343 | 1.74% |
| Wyoming | 6 | 10 | 16 | 16 | 5 | 53 | 0.27% |
| York | 212 | 191 | 170 | 142 | 77 | 792 | 4.01% |
| Grand Total | 3,336 | 5,054 | 4,793 | 4,292 | 2,293 | 19,768 | N/A |