
News
Drug Delivery Resulting in Death Charges in Pennsylvania

June 13, 2025
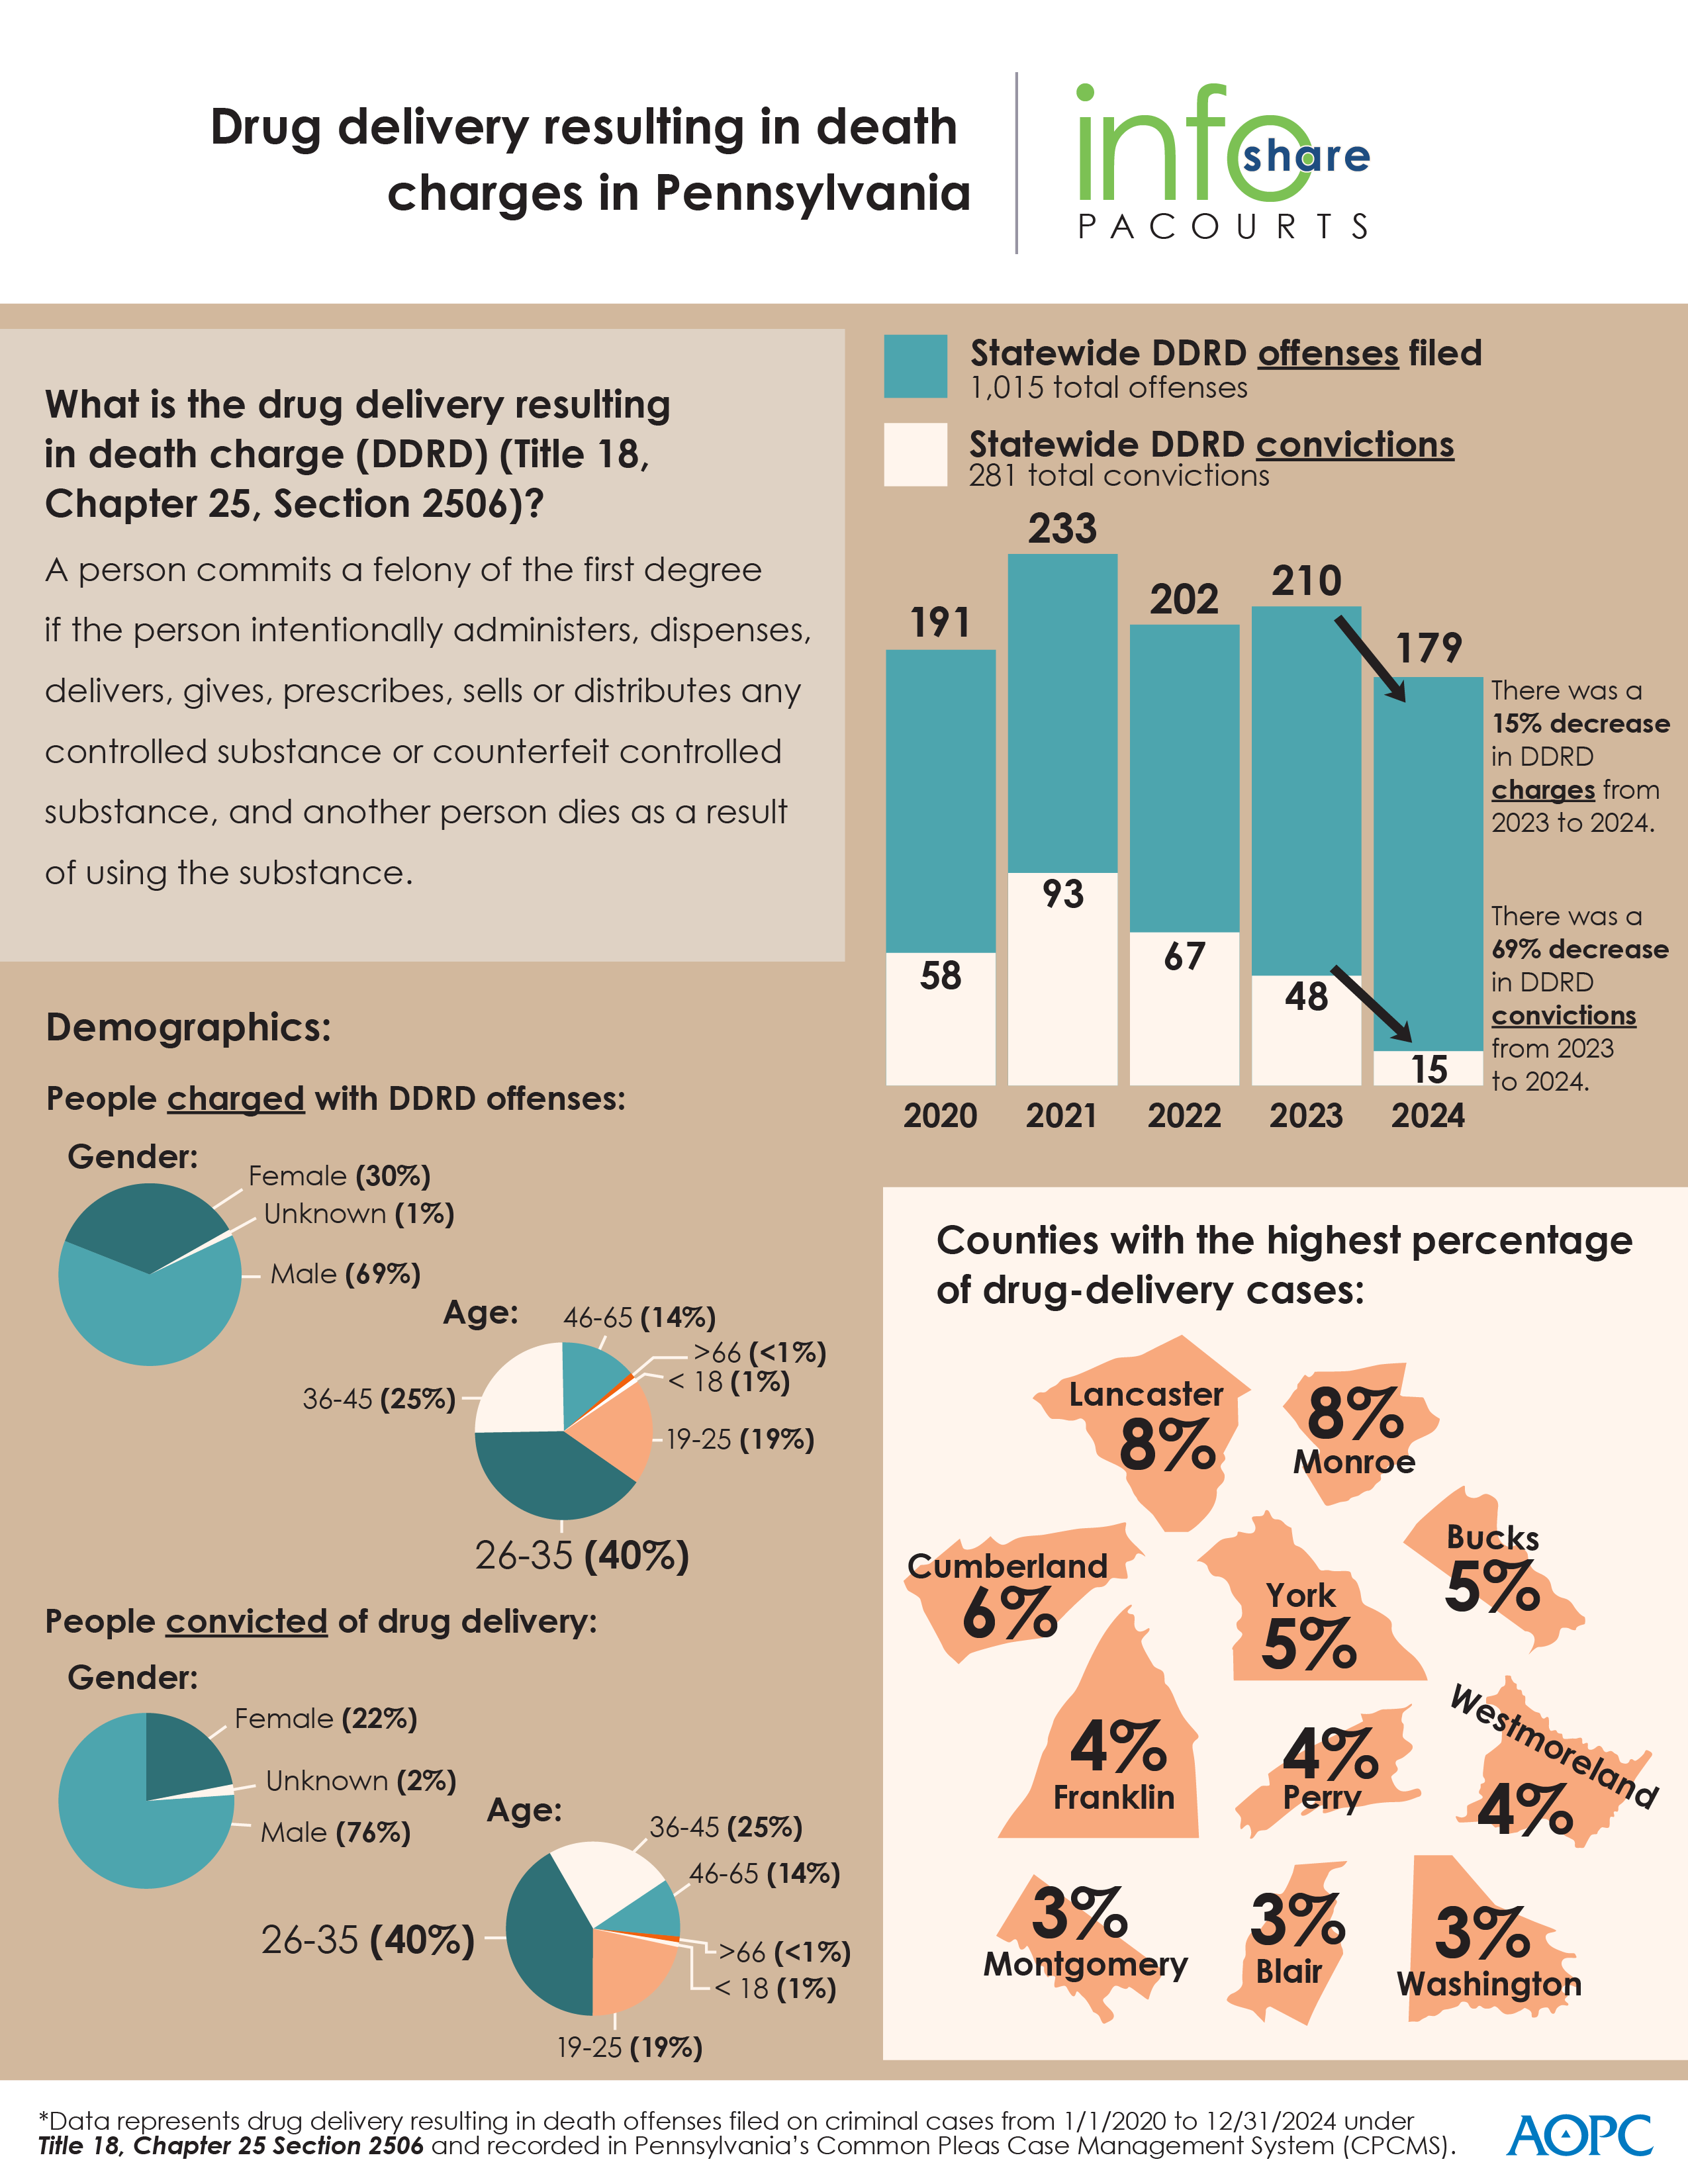
In Pennsylvania, a drug delivery resulting in death (DDRD) charge, also known as an offense, is issued to a person who intentionally administers, dispenses, delivers, gives, prescribes, sells or distributes any controlled substance, and another person died as a result of using the substance.
From 2023 to 2024, DDRD charges decreased by 15% and convictions decreased by 69%.
The infographic below highlights key data and demographics about DDRD charges and convictions in Pennsylvania over the past five years. Download a high-resolution file of the graphic and view county-by- county stats included at the end of this release.
PA Courts InfoShare is a monthly product of the Administrative Office of Pennsylvania Courts (AOPC) that visually highlights the work of the courts with interesting data and statistics obtained through the judiciary’s case management systems, interactive dashboards and other research. Reproduction is encouraged with source cited.
Media Contact: Olivia Antonucci, 609-238-5182
Editors Note:
|
Statewide number of criminal cases filed from 1/1/2020 through 12/31/2024 with a Drug Delivery Resulting in Death Offense; Grouped by County |
|||||||||||||
|
County |
2020 |
2021 |
2022 |
2023 |
2024 |
Total |
Percentage of Total |
||||||
|
Adams |
3 |
0 |
0 |
0 |
0 |
3 |
0.39% |
||||||
|
Allegheny |
1 |
1 |
1 |
2 |
8 |
13 |
1.68% |
||||||
|
Armstrong |
2 |
0 |
0 |
0 |
1 |
3 |
0.39% |
||||||
|
Beaver |
6 |
6 |
1 |
3 |
3 |
19 |
2.45% |
||||||
|
Bedford |
2 |
1 |
3 |
0 |
0 |
6 |
0.77% |
||||||
|
Berks |
3 |
9 |
1 |
4 |
1 |
18 |
2.32% |
||||||
|
Blair |
4 |
2 |
8 |
5 |
4 |
23 |
2.97% |
||||||
|
Bradford |
0 |
1 |
1 |
0 |
0 |
2 |
0.26% |
||||||
|
Bucks |
7 |
10 |
12 |
6 |
3 |
38 |
4.90% |
||||||
|
Butler |
1 |
1 |
2 |
0 |
1 |
5 |
0.65% |
||||||
|
Cambria |
1 |
0 |
0 |
2 |
1 |
4 |
0.52% |
||||||
|
Carbon |
0 |
0 |
0 |
0 |
1 |
1 |
0.13% |
||||||
|
Centre |
0 |
1 |
2 |
1 |
0 |
4 |
0.52% |
||||||
|
Chester |
5 |
1 |
3 |
4 |
8 |
21 |
2.71% |
||||||
|
Clarion |
0 |
0 |
0 |
2 |
11 |
13 |
1.68% |
||||||
|
Clearfield |
2 |
1 |
2 |
2 |
4 |
11 |
1.42% |
||||||
|
Columbia |
0 |
1 |
1 |
0 |
0 |
2 |
0.26% |
||||||
|
Crawford |
0 |
0 |
0 |
0 |
1 |
1 |
0.13% |
||||||
|
Cumberland |
12 |
7 |
14 |
6 |
6 |
45 |
5.81% |
||||||
|
Dauphin |
4 |
3 |
7 |
0 |
5 |
19 |
2.45% |
||||||
|
Delaware |
0 |
5 |
2 |
2 |
0 |
9 |
1.16% |
||||||
|
Elk |
3 |
1 |
7 |
4 |
0 |
15 |
1.94% |
||||||
|
Erie |
1 |
2 |
0 |
8 |
4 |
15 |
1.94% |
||||||
|
Fayette |
1 |
4 |
1 |
8 |
4 |
18 |
2.32% |
||||||
|
Franklin |
12 |
8 |
5 |
2 |
7 |
34 |
4.39% |
||||||
|
Fulton |
0 |
1 |
1 |
1 |
0 |
3 |
0.39% |
||||||
|
Greene |
0 |
1 |
0 |
0 |
5 |
6 |
0.77% |
||||||
|
Huntingdon |
0 |
0 |
0 |
4 |
1 |
5 |
0.65% |
||||||
|
Indiana |
0 |
1 |
0 |
4 |
0 |
5 |
0.65% |
||||||
|
Jefferson |
0 |
0 |
0 |
4 |
1 |
5 |
0.65% |
||||||
|
Lackawanna |
7 |
2 |
0 |
3 |
0 |
12 |
1.55% |
||||||
|
Lancaster |
17 |
13 |
16 |
6 |
8 |
60 |
7.74% |
||||||
|
Lawrence |
0 |
0 |
0 |
0 |
1 |
1 |
0.13% |
||||||
|
Lebanon |
0 |
2 |
1 |
3 |
0 |
6 |
0.77% |
||||||
|
Lehigh |
0 |
2 |
1 |
2 |
3 |
8 |
1.03% |
||||||
|
Luzerne |
0 |
1 |
6 |
2 |
2 |
11 |
1.42% |
||||||
|
Lycoming |
1 |
1 |
1 |
2 |
0 |
5 |
0.65% |
||||||
|
McKean |
0 |
0 |
1 |
2 |
0 |
3 |
0.39% |
||||||
|
Mercer |
4 |
3 |
4 |
7 |
2 |
20 |
2.58% |
||||||
|
Mifflin |
0 |
1 |
0 |
1 |
0 |
2 |
0.26% |
||||||
|
Monroe |
22 |
15 |
7 |
9 |
8 |
61 |
7.87% |
||||||
|
Montgomery |
2 |
10 |
5 |
5 |
0 |
22 |
2.84% |
||||||
|
Northampton |
1 |
6 |
2 |
0 |
1 |
10 |
1.29% |
||||||
|
Northumberland |
0 |
0 |
1 |
3 |
0 |
4 |
0.52% |
||||||
|
Perry |
9 |
9 |
4 |
5 |
3 |
30 |
3.87% |
||||||
|
Philadelphia |
2 |
4 |
2 |
0 |
1 |
9 |
1.16% |
||||||
|
Pike |
3 |
5 |
2 |
0 |
0 |
10 |
1.29% |
||||||
|
Schuylkill |
1 |
0 |
0 |
4 |
2 |
7 |
0.90% |
||||||
|
Snyder |
0 |
1 |
0 |
0 |
1 |
2 |
0.26% |
||||||
|
Somerset |
3 |
4 |
0 |
0 |
0 |
7 |
0.90% |
||||||
|
Tioga |
0 |
0 |
0 |
1 |
1 |
2 |
0.26% |
||||||
|
Union |
2 |
0 |
0 |
0 |
0 |
2 |
0.26% |
||||||
|
Venango |
1 |
2 |
4 |
1 |
1 |
9 |
1.16% |
||||||
|
Warren |
0 |
0 |
0 |
2 |
0 |
2 |
0.26% |
||||||
|
Washington |
8 |
6 |
2 |
1 |
9 |
26 |
3.35% |
||||||
|
Wayne |
1 |
0 |
2 |
1 |
0 |
4 |
0.52% |
||||||
|
Westmoreland |
7 |
15 |
6 |
1 |
4 |
33 |
4.26% |
||||||
|
Wyoming |
0 |
0 |
0 |
1 |
0 |
1 |
0.13% |
||||||
|
York |
4 |
8 |
12 |
7 |
9 |
40 |
5.16% |
||||||
|
Grand Total |
165 |
178 |
153 |
143 |
136 |
775 |
n/a |
||||||