
News
Traffic Citations in School Zones

August 08, 2025
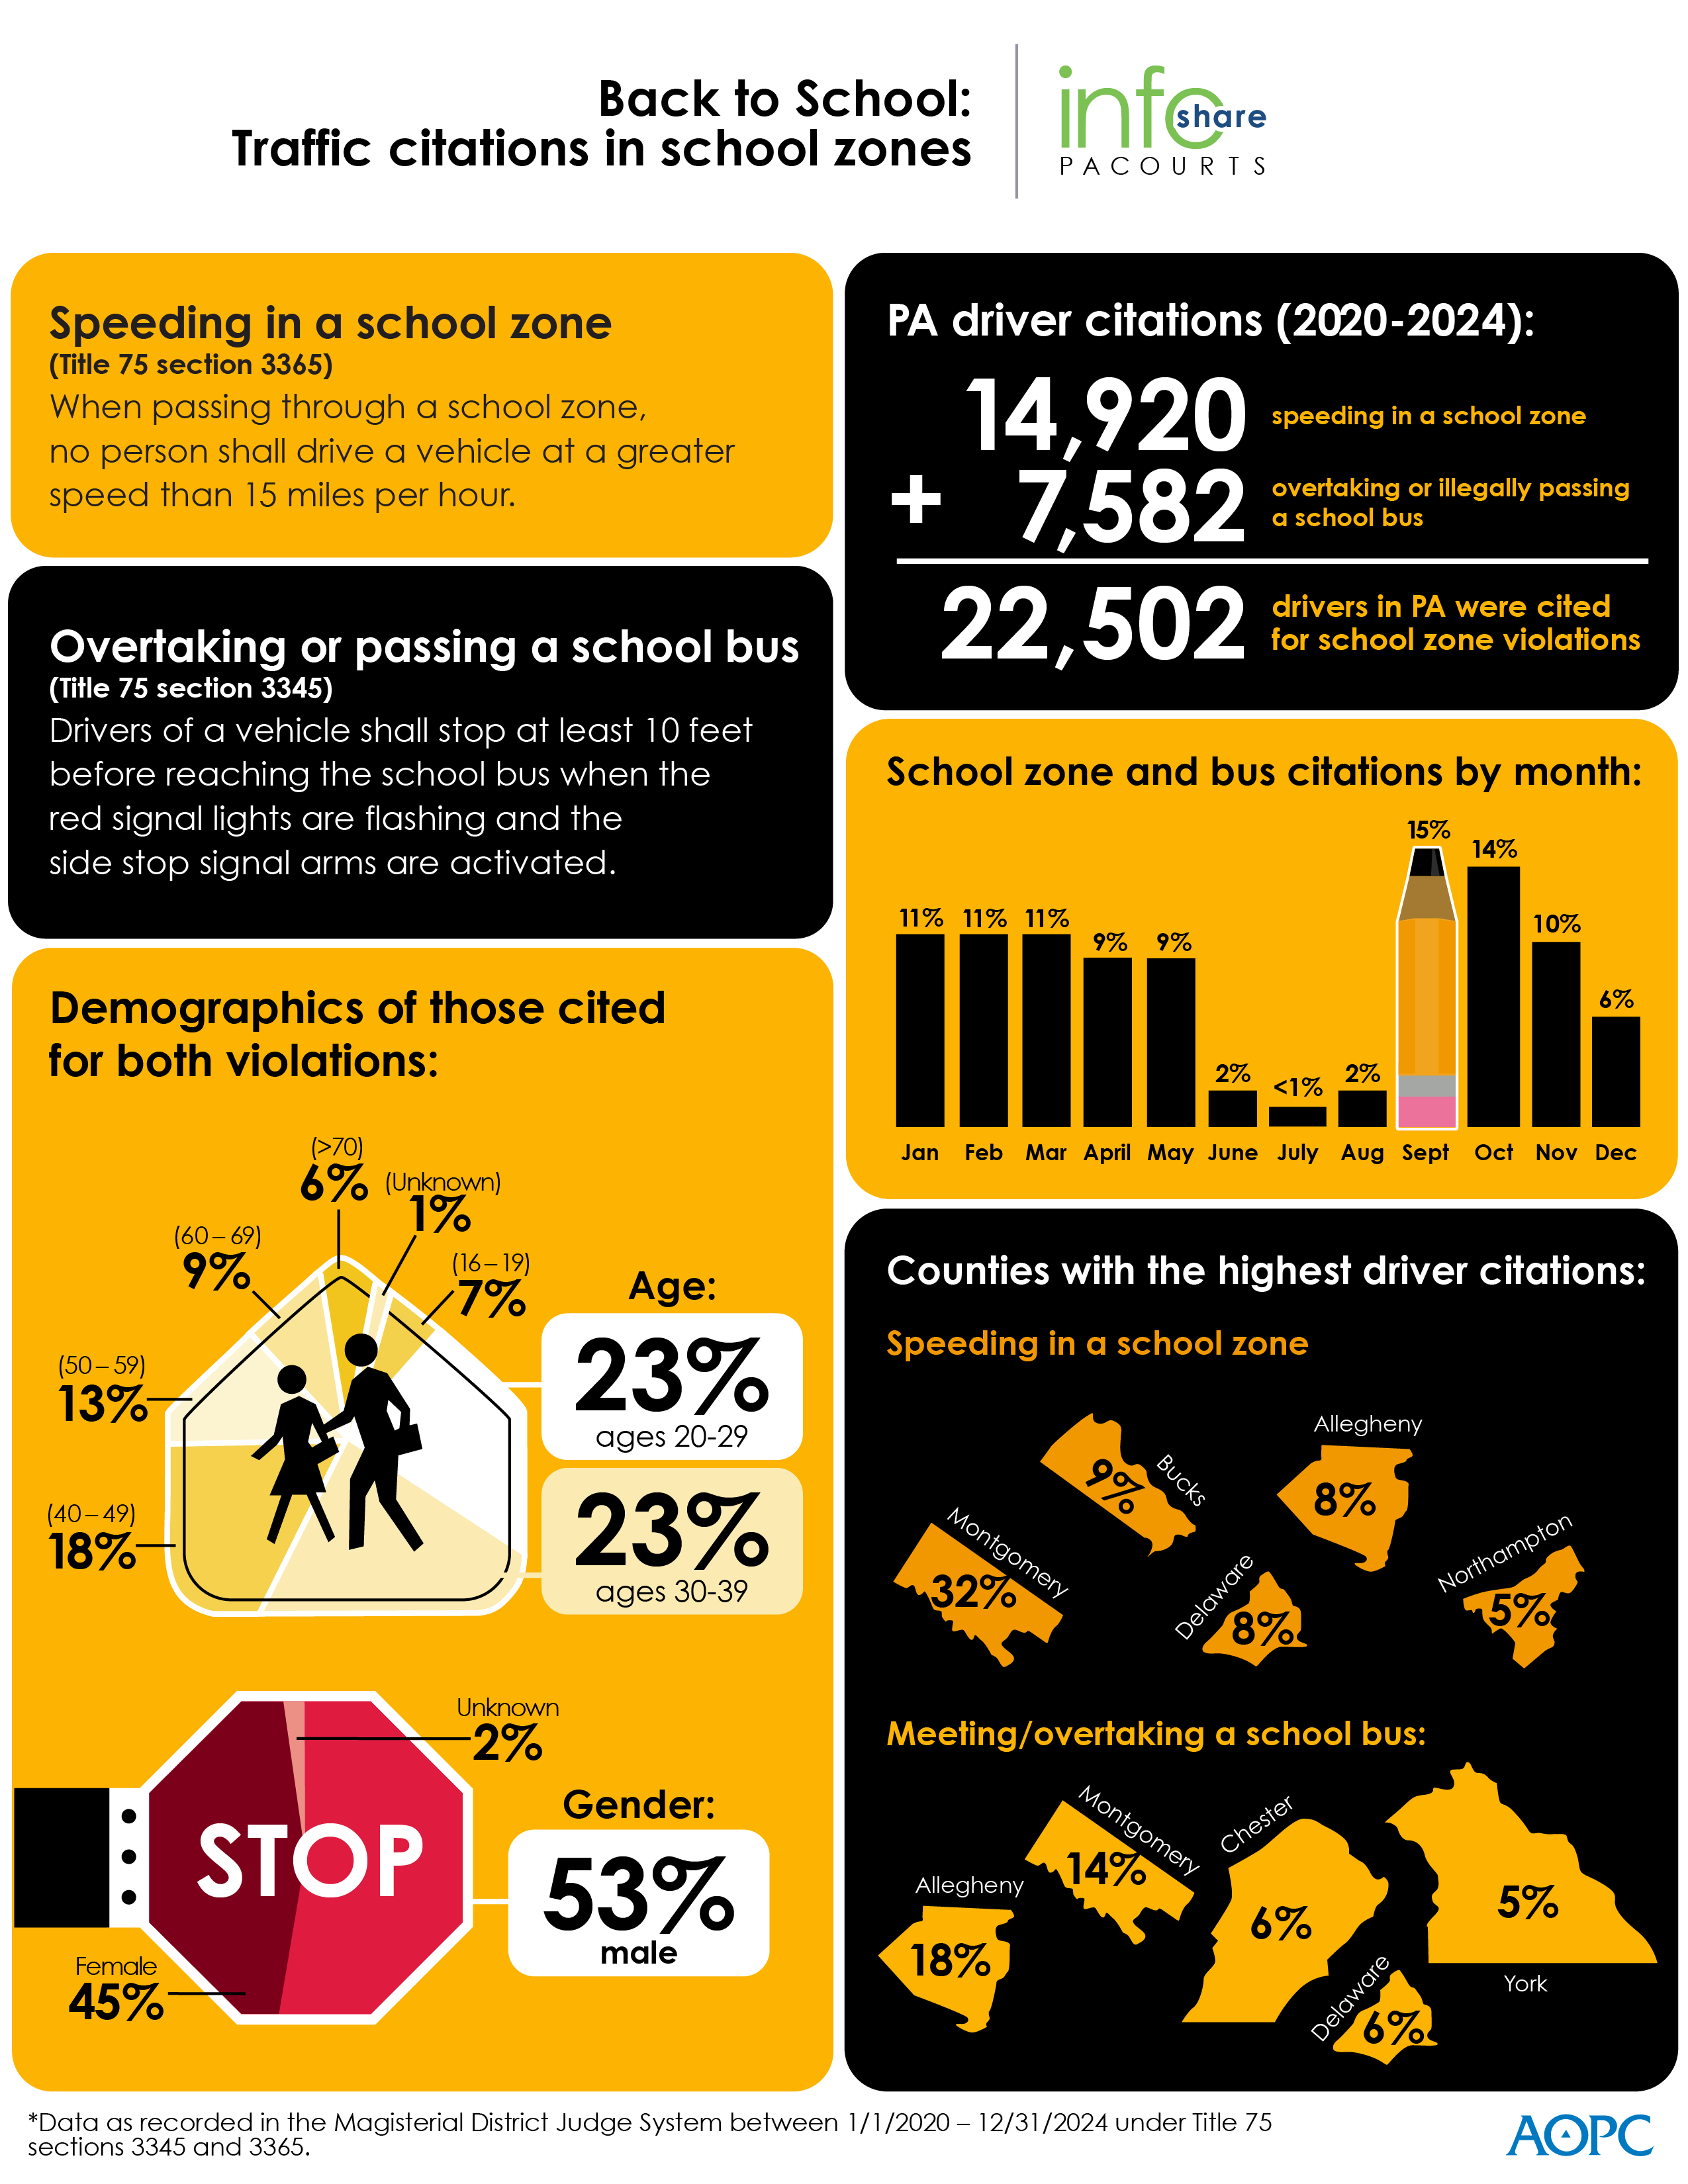
As the new school year approaches, the Pennsylvania Courts wants to remind drivers to slow down in school zones, stop for school buses and stay alert to help ensure the safety of our students. Over the past five years (2020-2024), 22,502 Pennsylvania drivers have been cited for school zone violations.
A high-resolution file of the graphic is available for download. And county level detail is provided at the end of the release.
PA Courts InfoShare is a monthly product of the Administrative Office of Pennsylvania Courts (AOPC) that visually highlights the work of the courts with interesting data and statistics obtained through the judiciary’s case management systems, interactive dashboards and other research. Reproduction is encouraged with source cited.
###
Media Contact: Olivia Antonucci, 609.238.5182
Editor’s Note:
|
Title 75 School Zone violations issued from 1/1/2020 through 12/31/2024, as recorded in the Magisterial District Judge System (MDJS); County Composition |
|||||||
|
Section / Offense Description |
Filed Year |
Total |
Percentage of Overall |
||||
|
2020 |
2021 |
2022 |
2023 |
2024 |
|||
|
3345 / Meeting/Overtaking School Bus |
976 |
1,497 |
1,815 |
1,762 |
1,532 |
7,582 |
N/A |
|
Adams |
7 |
8 |
6 |
4 |
12 |
37 |
0.49% |
|
Allegheny |
169 |
294 |
313 |
300 |
262 |
1338 |
17.65% |
|
Armstrong |
1 |
4 |
1 |
6 |
3 |
15 |
0.20% |
|
Beaver |
4 |
16 |
49 |
44 |
34 |
147 |
1.94% |
|
Bedford |
8 |
6 |
6 |
4 |
4 |
28 |
0.37% |
|
Berks |
23 |
39 |
51 |
53 |
61 |
227 |
2.99% |
|
Blair |
9 |
8 |
8 |
13 |
4 |
42 |
0.55% |
|
Bradford |
3 |
8 |
14 |
8 |
2 |
35 |
0.46% |
|
Bucks |
45 |
71 |
115 |
187 |
94 |
512 |
6.75% |
|
Butler |
59 |
61 |
54 |
77 |
28 |
279 |
3.68% |
|
Cambria |
6 |
21 |
13 |
6 |
20 |
66 |
0.87% |
|
Cameron |
0 |
0 |
0 |
1 |
3 |
4 |
0.05% |
|
Carbon |
1 |
6 |
4 |
5 |
8 |
24 |
0.32% |
|
Centre |
7 |
16 |
7 |
8 |
6 |
44 |
0.58% |
|
Chester |
50 |
75 |
118 |
92 |
119 |
454 |
5.99% |
|
Clarion |
1 |
4 |
2 |
1 |
1 |
9 |
0.12% |
|
Clearfield |
4 |
2 |
4 |
5 |
5 |
20 |
0.26% |
|
Clinton |
1 |
0 |
1 |
0 |
1 |
3 |
0.04% |
|
Columbia |
6 |
8 |
14 |
7 |
2 |
37 |
0.49% |
|
Crawford |
3 |
3 |
3 |
3 |
3 |
15 |
0.20% |
|
Cumberland |
16 |
29 |
33 |
43 |
25 |
146 |
1.93% |
|
Dauphin |
23 |
35 |
35 |
23 |
29 |
145 |
1.91% |
|
Delaware |
58 |
95 |
89 |
107 |
99 |
448 |
5.91% |
|
Elk |
0 |
3 |
1 |
1 |
3 |
8 |
0.11% |
|
Erie |
24 |
53 |
41 |
38 |
32 |
188 |
2.48% |
|
Fayette |
4 |
5 |
14 |
4 |
4 |
31 |
0.41% |
|
Forest |
0 |
1 |
2 |
0 |
0 |
3 |
0.04% |
|
Franklin |
4 |
9 |
24 |
11 |
17 |
65 |
0.86% |
|
Fulton |
2 |
0 |
0 |
5 |
1 |
8 |
0.11% |
|
Greene |
0 |
1 |
5 |
1 |
1 |
8 |
0.11% |
|
Huntingdon |
2 |
0 |
2 |
0 |
1 |
5 |
0.07% |
|
Indiana |
3 |
1 |
6 |
1 |
2 |
13 |
0.17% |
|
Jefferson |
3 |
4 |
7 |
8 |
6 |
28 |
0.37% |
|
Juniata |
0 |
1 |
3 |
0 |
1 |
5 |
0.07% |
|
Lackawanna |
8 |
13 |
20 |
23 |
18 |
82 |
1.08% |
|
Lancaster |
41 |
55 |
47 |
63 |
73 |
279 |
3.68% |
|
Lawrence |
1 |
5 |
1 |
2 |
7 |
16 |
0.21% |
|
Lebanon |
2 |
6 |
7 |
9 |
7 |
31 |
0.41% |
|
Lehigh |
29 |
93 |
52 |
40 |
39 |
253 |
3.34% |
|
Luzerne |
14 |
27 |
34 |
38 |
36 |
149 |
1.97% |
|
Lycoming |
6 |
3 |
4 |
4 |
10 |
27 |
0.36% |
|
McKean |
3 |
3 |
9 |
4 |
5 |
24 |
0.32% |
|
Mercer |
5 |
5 |
7 |
9 |
4 |
30 |
0.40% |
|
Mifflin |
1 |
15 |
10 |
12 |
2 |
40 |
0.53% |
|
Monroe |
10 |
15 |
14 |
13 |
14 |
66 |
0.87% |
|
Montgomery |
160 |
193 |
282 |
218 |
206 |
1059 |
13.97% |
|
Montour |
0 |
3 |
1 |
3 |
0 |
7 |
0.09% |
|
Northampton |
20 |
33 |
27 |
23 |
28 |
131 |
1.73% |
|
Northumberland |
11 |
8 |
19 |
8 |
10 |
56 |
0.74% |
|
Perry |
1 |
1 |
3 |
4 |
0 |
9 |
0.12% |
|
Philadelphia |
9 |
3 |
8 |
7 |
17 |
44 |
0.58% |
|
Pike |
2 |
2 |
2 |
2 |
3 |
11 |
0.15% |
|
Potter |
2 |
2 |
1 |
0 |
0 |
5 |
0.07% |
|
Schuylkill |
8 |
16 |
14 |
8 |
11 |
57 |
0.75% |
|
Snyder |
4 |
3 |
6 |
2 |
3 |
18 |
0.24% |
|
Somerset |
0 |
2 |
4 |
7 |
5 |
18 |
0.24% |
|
Sullivan |
0 |
0 |
0 |
3 |
1 |
4 |
0.05% |
|
Susquehanna |
1 |
1 |
0 |
7 |
1 |
10 |
0.13% |
|
Tioga |
4 |
2 |
2 |
7 |
6 |
21 |
0.28% |
|
Union |
1 |
4 |
3 |
0 |
2 |
10 |
0.13% |
|
Venango |
5 |
11 |
4 |
4 |
3 |
27 |
0.36% |
|
Warren |
2 |
1 |
2 |
1 |
2 |
8 |
0.11% |
|
Washington |
14 |
9 |
19 |
31 |
24 |
97 |
1.28% |
|
Wayne |
2 |
2 |
4 |
8 |
7 |
23 |
0.30% |
|
Westmoreland |
21 |
16 |
38 |
30 |
36 |
141 |
1.86% |
|
Wyoming |
7 |
4 |
12 |
8 |
4 |
35 |
0.46% |
|
York |
36 |
54 |
114 |
98 |
55 |
357 |
4.71% |
|
3365 / Speeding In School Zone |
1,933 |
2,812 |
3,027 |
3,496 |
3,652 |
14,920 |
N/A |
|
Adams |
38 |
21 |
17 |
60 |
56 |
192 |
1.29% |
|
Allegheny |
181 |
133 |
253 |
297 |
308 |
1172 |
7.86% |
|
Armstrong |
0 |
8 |
6 |
2 |
3 |
19 |
0.13% |
|
Beaver |
54 |
98 |
127 |
104 |
100 |
483 |
3.24% |
|
Bedford |
1 |
0 |
1 |
8 |
0 |
10 |
0.07% |
|
Berks |
37 |
90 |
68 |
109 |
164 |
468 |
3.14% |
|
Blair |
1 |
5 |
0 |
18 |
8 |
32 |
0.21% |
|
Bradford |
0 |
0 |
1 |
0 |
0 |
1 |
0.01% |
|
Bucks |
197 |
275 |
294 |
293 |
274 |
1333 |
8.93% |
|
Butler |
12 |
14 |
3 |
8 |
10 |
47 |
0.32% |
|
Cambria |
13 |
11 |
27 |
78 |
64 |
193 |
1.29% |
|
Cameron |
1 |
1 |
0 |
1 |
0 |
3 |
0.02% |
|
Carbon |
4 |
2 |
21 |
19 |
43 |
89 |
0.60% |
|
Centre |
2 |
7 |
6 |
3 |
7 |
25 |
0.17% |
|
Chester |
27 |
59 |
136 |
236 |
229 |
687 |
4.60% |
|
Clinton |
1 |
0 |
0 |
6 |
0 |
7 |
0.05% |
|
Columbia |
1 |
0 |
0 |
0 |
0 |
1 |
0.01% |
|
Crawford |
4 |
0 |
6 |
0 |
1 |
11 |
0.07% |
|
Cumberland |
18 |
26 |
28 |
70 |
38 |
180 |
1.21% |
|
Dauphin |
39 |
21 |
32 |
38 |
41 |
171 |
1.15% |
|
Delaware |
71 |
248 |
342 |
227 |
268 |
1156 |
7.75% |
|
Elk |
1 |
1 |
6 |
15 |
13 |
36 |
0.24% |
|
Erie |
112 |
128 |
79 |
103 |
122 |
544 |
3.65% |
|
Fayette |
1 |
1 |
0 |
0 |
3 |
5 |
0.03% |
|
Franklin |
45 |
33 |
31 |
28 |
13 |
150 |
1.01% |
|
Fulton |
2 |
2 |
1 |
0 |
0 |
5 |
0.03% |
|
Greene |
1 |
14 |
2 |
0 |
1 |
18 |
0.12% |
|
Huntingdon |
1 |
0 |
2 |
0 |
0 |
3 |
0.02% |
|
Indiana |
4 |
11 |
11 |
5 |
1 |
32 |
0.21% |
|
Jefferson |
10 |
13 |
128 |
156 |
52 |
359 |
2.41% |
|
Juniata |
0 |
2 |
1 |
0 |
2 |
5 |
0.03% |
|
Lackawanna |
1 |
20 |
11 |
21 |
22 |
75 |
0.50% |
|
Lancaster |
26 |
135 |
50 |
0 |
10 |
221 |
1.48% |
|
Lawrence |
0 |
1 |
6 |
7 |
6 |
20 |
0.13% |
|
Lebanon |
17 |
16 |
33 |
22 |
34 |
122 |
0.82% |
|
Lehigh |
16 |
9 |
44 |
16 |
24 |
109 |
0.73% |
|
Luzerne |
15 |
84 |
27 |
39 |
58 |
223 |
1.49% |
|
Lycoming |
0 |
0 |
1 |
1 |
0 |
2 |
0.01% |
|
McKean |
0 |
2 |
0 |
0 |
0 |
2 |
0.01% |
|
Mercer |
2 |
32 |
58 |
83 |
23 |
198 |
1.33% |
|
Mifflin |
0 |
0 |
1 |
4 |
1 |
6 |
0.04% |
|
Monroe |
0 |
3 |
0 |
17 |
21 |
41 |
0.27% |
|
Montgomery |
742 |
933 |
791 |
1047 |
1244 |
4757 |
31.88% |
|
Montour |
0 |
1 |
0 |
0 |
0 |
1 |
0.01% |
|
Northampton |
115 |
155 |
177 |
132 |
159 |
738 |
4.95% |
|
Northumberland |
1 |
4 |
3 |
0 |
4 |
12 |
0.08% |
|
Philadelphia |
0 |
0 |
12 |
35 |
9 |
56 |
0.38% |
|
Potter |
0 |
0 |
10 |
9 |
1 |
20 |
0.13% |
|
Schuylkill |
1 |
0 |
0 |
0 |
0 |
1 |
0.01% |
|
Snyder |
0 |
2 |
3 |
0 |
2 |
7 |
0.05% |
|
Somerset |
2 |
1 |
1 |
0 |
4 |
8 |
0.05% |
|
Tioga |
0 |
0 |
0 |
1 |
4 |
5 |
0.03% |
|
Union |
9 |
2 |
4 |
1 |
2 |
18 |
0.12% |
|
Venango |
9 |
76 |
69 |
28 |
23 |
205 |
1.37% |
|
Warren |
1 |
0 |
0 |
0 |
1 |
2 |
0.01% |
|
Washington |
13 |
44 |
14 |
60 |
79 |
210 |
1.41% |
|
Westmoreland |
61 |
59 |
62 |
67 |
80 |
329 |
2.21% |
|
Wyoming |
0 |
0 |
0 |
0 |
0 |
0 |
0.00% |
|
York |
23 |
9 |
21 |
22 |
20 |
95 |
0.64% |
|
Grand Total |
2,909 |
4,309 |
4,842 |
5,258 |
5,184 |
22,502 |
N/A |