
News
A snapshot of sexual offenders in Pennsylvania

April 15, 2016
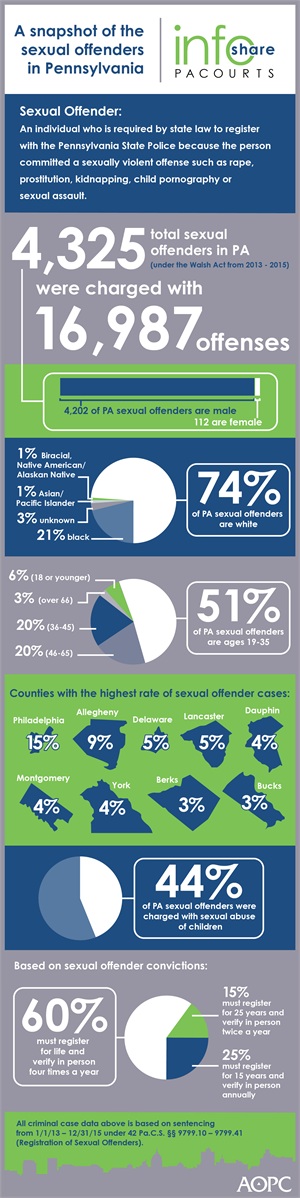
Under Pennsylvania’s Adam Walsh Act, 4,325 people were sentenced as sexual offenders between January 2013 – December 2015, and were charged with 16,987 offenses. Of those sexual offenders who were sentenced, 51% were between the ages of 19-35, and 44% were charged with sexual abuse of children.
The infographic below highlights key data and demographics about sexual offenders in Pennsylvania. Download a high-resolution version of the graphic.
PA Courts InfoShare is a bi-weekly product of the Administrative Office of Pennsylvania Courts (AOPC) that visually highlights the work of the courts with interesting data and statistics obtained through the judiciary’s case management systems, interactive dashboards and other research. Reproduction is permissible with source cited.
Editor’s Note: County level detail below for total number of criminal cases sentenced from 1/1/2013 – 12/31/2015 for a Walsh Act Offense.
###
Media contact: Kimberly Bathgate, 717-231-3331
| County | 2013 | 2014 | 2015 | Total | Percentage of Total |
| Adams | 7 | 11 | 19 | 37 | 0.78% |
| Allegheny | 106 | 164 | 177 | 447 | 9.40% |
| Armstrong | 5 | 4 | 10 | 19 | 0.40% |
| Beaver | 13 | 16 | 22 | 51 | 1.07% |
| Bedford | 5 | 9 | 12 | 26 | 0.55% |
| Berks | 54 | 46 | 64 | 164 | 3.45% |
| Blair | 16 | 22 | 27 | 65 | 1.37% |
| Bradford | 8 | 22 | 18 | 48 | 1.01% |
| Bucks | 32 | 47 | 64 | 143 | 3.01% |
| Butler | 9 | 18 | 17 | 44 | 0.93% |
| Cambria | 11 | 24 | 12 | 47 | 0.99% |
| Cameron |
|
| 2 | 2 | 0.04% |
| Carbon | 4 | 15 | 8 | 27 | 0.57% |
| Centre | 11 | 13 | 23 | 47 | 0.99% |
| Chester | 29 | 31 | 48 | 108 | 2.27% |
| Clarion | 6 | 5 | 4 | 15 | 0.32% |
| Clearfield | 7 | 10 | 10 | 27 | 0.57% |
| Clinton | 6 | 5 | 12 | 23 | 0.48% |
| Columbia | 4 | 7 | 4 | 15 | 0.32% |
| Crawford | 10 | 18 | 18 | 46 | 0.97% |
| Cumberland | 21 | 30 | 36 | 87 | 1.83% |
| Dauphin | 42 | 72 | 69 | 183 | 3.85% |
| Delaware | 38 | 79 | 98 | 215 | 4.52% |
| Elk | 2 | 4 | 5 | 11 | 0.23% |
| Erie | 17 | 50 | 35 | 102 | 2.14% |
| Fayette | 19 | 48 | 21 | 88 | 1.85% |
| Forest | 2 | 1 | 2 | 5 | 0.11% |
| Franklin | 19 | 25 | 35 | 79 | 1.66% |
| Fulton | 2 | 2 | 8 | 12 | 0.25% |
| Greene |
| 6 | 5 | 11 | 0.23% |
| Huntingdon | 7 | 8 | 10 | 25 | 0.53% |
| Indiana | 11 | 15 | 14 | 40 | 0.84% |
| Jefferson | 7 | 10 | 9 | 26 | 0.55% |
| Juniata | 3 | 3 | 4 | 10 | 0.21% |
| Lackawanna | 9 | 21 | 35 | 65 | 1.37% |
| Lancaster | 76 | 71 | 110 | 257 | 5.40% |
| Lawrence | 9 | 11 | 11 | 31 | 0.65% |
| Lebanon | 17 | 27 | 37 | 81 | 1.70% |
| Lehigh | 17 | 18 | 28 | 63 | 1.32% |
| Luzerne | 16 | 42 | 49 | 107 | 2.25% |
| Lycoming | 12 | 12 | 15 | 39 | 0.82% |
| McKean | 7 | 17 | 4 | 28 | 0.59% |
| Mercer | 15 | 21 | 19 | 55 | 1.16% |
| Mifflin | 5 | 7 | 5 | 17 | 0.36% |
| Monroe | 21 | 33 | 31 | 85 | 1.79% |
| Montgomery | 33 | 60 | 82 | 175 | 3.68% |
| Montour | 1 |
| 3 | 4 | 0.08% |
| Northampton | 15 | 24 | 25 | 64 | 1.35% |
| Northumberland | 8 | 10 | 26 | 44 | 0.93% |
| Perry | 5 | 11 | 5 | 21 | 0.44% |
| Philadelphia | 187 | 264 | 256 | 707 | 14.87% |
| Pike | 3 | 7 | 7 | 17 | 0.36% |
| Potter | 4 | 9 | 6 | 19 | 0.40% |
| Schuylkill | 10 | 12 | 27 | 49 | 1.03% |
| Snyder | 3 | 4 | 3 | 10 | 0.21% |
| Somerset | 5 | 12 | 11 | 28 | 0.59% |
| Susquehanna | 2 | 10 | 5 | 17 | 0.36% |
| Tioga | 4 | 6 | 5 | 15 | 0.32% |
| Union | 1 | 5 | 5 | 11 | 0.23% |
| Venango | 7 | 7 | 11 | 25 | 0.53% |
| Warren | 10 | 14 | 15 | 39 | 0.82% |
| Washington | 22 | 13 | 40 | 75 | 1.58% |
| Wayne | 7 | 5 | 9 | 21 | 0.44% |
| Westmoreland | 22 | 39 | 47 | 108 | 2.27% |
| Wyoming | 2 | 4 | 3 | 9 | 0.19% |
| York | 36 | 67 | 72 | 175 | 3.68% |
| Grand Total | 1,124 | 1,703 | 1,929 | 4,756 | 100.00% |