
News
Back to school: Traffic citations in school zones

September 09, 2016
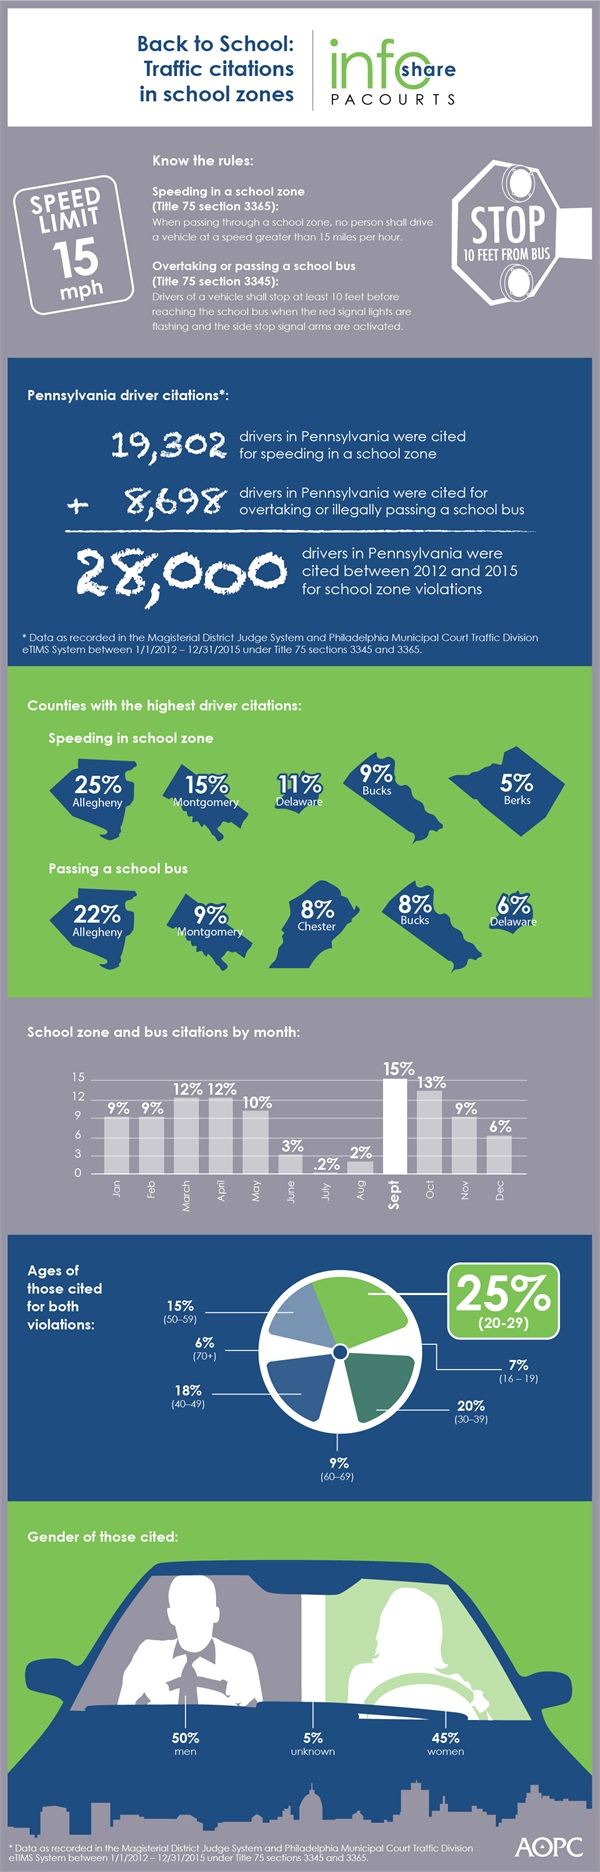
It’s that time of year again for flashing yellow lights warning of school zone speed limits of 15 mph, and for children of all ages to board buses across the state. Over the past four years, 28,000 Pennsylvania drivers had been cited with school zone violations – for either speeding in school zones or illegally passing a school bus. September and October were the heaviest months for school zone citations. (See end of release for county-by-county data).
The infographic below highlights school zone data related to citations under Title 18 sections 3345 and 3365 from the Magisterial District Judge System and Philadelphia Municipal Court Traffic Division eTIMS system. We encourage reporters to use the full graphic, or parts of the graphic, by downloading a high-resolution version.
PA Courts InfoShare is a bi-weekly product of the Administrative Office of Pennsylvania Courts (AOPC) that visually highlights the work of the courts with interesting data and statistics obtained through the judiciary’s case management systems, interactive dashboards and other research. Reproduction is permissible with source cited.
##
Media contact: Kimberly Bathgate, 717-231-3331
Editor’s note:
See below for county-by-county data.
| Title 75 School Zone violations issued from 1/1/2012 through 12/31/2015 as recorded in the Magisterial District Judge System (MDJS) and Philadelphia Municipal Court Traffic Division eTIMS System; County Composition | ||||||
| Section / Offense Description | Filed Year | Total | Percentage of Overall | |||
| 2012 | 2013 | 2014 | 2015 | |||
| 3345 / Meeting/Overtaking School Bus | 2,172 | 2,339 | 1,979 | 2,208 | 8,698 | N/A |
| Adams | 20 | 5 | 14 | 17 | 56 | 0.64% |
| Allegheny | 566 | 557 | 385 | 372 | 1,880 | 21.61% |
| Armstrong | 4 | 15 | 12 | 19 | 50 | 0.57% |
| Beaver | 15 | 21 | 10 | 27 | 73 | 0.84% |
| Bedford | 3 | 6 | 4 | 4 | 17 | 0.20% |
| Berks | 77 | 54 | 70 | 50 | 251 | 2.89% |
| Blair | 14 | 3 | 2 | 14 | 33 | 0.38% |
| Bradford | 2 | 0 | 11 | 11 | 24 | 0.28% |
| Bucks | 157 | 220 | 136 | 161 | 674 | 7.75% |
| Butler | 24 | 29 | 58 | 87 | 198 | 2.28% |
| Cambria | 26 | 17 | 19 | 18 | 80 | 0.92% |
| Cameron | 3 | 1 | 0 | 0 | 4 | 0.05% |
| Carbon | 6 | 5 | 3 | 3 | 17 | 0.20% |
| Centre | 6 | 8 | 15 | 21 | 50 | 0.57% |
| Chester | 122 | 194 | 205 | 162 | 683 | 7.85% |
| Clarion | 5 | 3 | 4 | 1 | 13 | 0.15% |
| Clearfield | 4 | 2 | 5 | 3 | 14 | 0.16% |
| Clinton | 5 | 3 | 1 | 0 | 9 | 0.10% |
| Columbia | 5 | 9 | 4 | 7 | 25 | 0.29% |
| Crawford | 11 | 12 | 10 | 14 | 47 | 0.54% |
| Cumberland | 32 | 34 | 28 | 39 | 133 | 1.53% |
| Dauphin | 63 | 46 | 62 | 105 | 276 | 3.17% |
| Delaware | 139 | 165 | 107 | 145 | 556 | 6.39% |
| Elk | 1 | 1 | 2 | 2 | 6 | 0.07% |
| Erie | 103 | 78 | 80 | 68 | 329 | 3.78% |
| Fayette | 5 | 1 | 6 | 2 | 14 | 0.16% |
| Forest | 1 | 0 | 0 | 0 | 1 | 0.01% |
| Franklin | 10 | 21 | 15 | 16 | 62 | 0.71% |
| Fulton | 1 | 2 | 1 | 4 | 8 | 0.09% |
| Greene | 1 | 0 | 2 | 6 | 9 | 0.10% |
| Huntingdon | 4 | 4 | 5 | 3 | 16 | 0.18% |
| Indiana | 4 | 4 | 3 | 11 | 22 | 0.25% |
| Jefferson | 5 | 10 | 3 | 18 | 36 | 0.41% |
| Juniata | 4 | 2 | 1 | 3 | 10 | 0.11% |
| Lackawanna | 15 | 15 | 16 | 24 | 70 | 0.80% |
| Lancaster | 35 | 42 | 52 | 50 | 179 | 2.06% |
| Lawrence | 11 | 10 | 7 | 7 | 35 | 0.40% |
| Lebanon | 9 | 13 | 6 | 4 | 32 | 0.37% |
| Lehigh | 49 | 87 | 41 | 85 | 262 | 3.01% |
| Luzerne | 28 | 19 | 20 | 24 | 91 | 1.05% |
| Lycoming | 14 | 10 | 20 | 9 | 53 | 0.61% |
| McKean | 4 | 4 | 3 | 3 | 14 | 0.16% |
| Mercer | 3 | 7 | 2 | 28 | 40 | 0.46% |
| Mifflin | 2 | 2 | 3 | 3 | 10 | 0.11% |
| Monroe | 11 | 4 | 13 | 19 | 47 | 0.54% |
| Montgomery | 224 | 201 | 174 | 204 | 803 | 9.23% |
| Montour | 0 | 1 | 3 | 1 | 5 | 0.06% |
| Northampton | 47 | 57 | 49 | 65 | 218 | 2.51% |
| Northumberland | 10 | 7 | 13 | 6 | 36 | 0.41% |
| Perry | 6 | 13 | 7 | 5 | 31 | 0.36% |
| Philadelphia | 99 | 122 | 109 | 91 | 421 | 4.84% |
| Pike | 2 | 2 | 1 | 8 | 13 | 0.15% |
| Potter | 1 | 1 | 3 | 2 | 7 | 0.08% |
| Schuylkill | 8 | 13 | 9 | 17 | 47 | 0.54% |
| Snyder | 2 | 11 | 5 | 4 | 22 | 0.25% |
| Somerset | 2 | 5 | 5 | 1 | 13 | 0.15% |
| Sullivan | 1 | 1 | 0 | 0 | 2 | 0.02% |
| Susquehanna | 1 | 2 | 5 | 1 | 9 | 0.10% |
| Tioga | 1 | 5 | 0 | 4 | 10 | 0.11% |
| Union | 1 | 2 | 0 | 2 | 5 | 0.06% |
| Venango | 3 | 7 | 7 | 3 | 20 | 0.23% |
| Warren | 7 | 3 | 2 | 1 | 13 | 0.15% |
| Washington | 25 | 34 | 22 | 34 | 115 | 1.32% |
| Wayne | 3 | 4 | 0 | 3 | 10 | 0.11% |
| Westmoreland | 46 | 38 | 38 | 22 | 144 | 1.66% |
| Wyoming | 2 | 0 | 1 | 0 | 3 | 0.03% |
| York | 52 | 65 | 60 | 65 | 242 | 2.78% |
| 3365 / Speeding In School Zone | 5,557 | 5,079 | 4,367 | 4,299 | 19,302 | N/A |
| Adams | 66 | 51 | 62 | 109 | 288 | 1.49% |
| Allegheny | 1,661 | 1,336 | 906 | 898 | 4,801 | 24.87% |
| Armstrong | 1 | 2 | 3 | 3 | 9 | 0.05% |
| Beaver | 184 | 96 | 80 | 209 | 569 | 2.95% |
| Bedford | 0 | 2 | 1 | 0 | 3 | 0.02% |
| Berks | 175 | 303 | 228 | 169 | 875 | 4.53% |
| Blair | 51 | 93 | 96 | 2 | 242 | 1.25% |
| Bradford | 0 | 0 | 6 | 1 | 7 | 0.04% |
| Bucks | 410 | 505 | 372 | 479 | 1,766 | 9.15% |
| Butler | 39 | 24 | 14 | 19 | 96 | 0.50% |
| Cambria | 23 | 12 | 16 | 30 | 81 | 0.42% |
| Carbon | 47 | 9 | 8 | 14 | 78 | 0.40% |
| Centre | 19 | 8 | 11 | 3 | 41 | 0.21% |
| Chester | 82 | 87 | 118 | 107 | 394 | 2.04% |
| Clarion | 1 | 3 | 4 | 1 | 9 | 0.05% |
| Clearfield | 0 | 13 | 21 | 29 | 63 | 0.33% |
| Clinton | 14 | 6 | 13 | 16 | 49 | 0.25% |
| Crawford | 3 | 6 | 3 | 4 | 16 | 0.08% |
| Cumberland | 51 | 59 | 144 | 60 | 314 | 1.63% |
| Dauphin | 64 | 134 | 128 | 59 | 385 | 1.99% |
| Delaware | 664 | 574 | 393 | 499 | 2,130 | 11.04% |
| Elk | 9 | 5 | 6 | 6 | 26 | 0.13% |
| Erie | 65 | 64 | 59 | 66 | 254 | 1.32% |
| Fayette | 0 | 13 | 1 | 5 | 19 | 0.10% |
| Forest | 1 | 0 | 0 | 0 | 1 | 0.01% |
| Franklin | 17 | 26 | 6 | 13 | 62 | 0.32% |
| Fulton | 0 | 0 | 2 | 7 | 9 | 0.05% |
| Greene | 8 | 21 | 12 | 6 | 47 | 0.24% |
| Huntingdon | 0 | 0 | 0 | 2 | 2 | 0.01% |
| Indiana | 6 | 5 | 17 | 6 | 34 | 0.18% |
| Jefferson | 3 | 3 | 7 | 6 | 19 | 0.10% |
| Juniata | 0 | 0 | 3 | 4 | 7 | 0.04% |
| Lackawanna | 22 | 11 | 14 | 8 | 55 | 0.28% |
| Lancaster | 42 | 40 | 21 | 7 | 110 | 0.57% |
| Lawrence | 10 | 7 | 3 | 6 | 26 | 0.13% |
| Lebanon | 61 | 55 | 56 | 29 | 201 | 1.04% |
| Lehigh | 31 | 31 | 96 | 80 | 238 | 1.23% |
| Luzerne | 79 | 27 | 13 | 28 | 147 | 0.76% |
| Lycoming | 1 | 0 | 0 | 0 | 1 | 0.01% |
| McKean | 0 | 1 | 1 | 0 | 2 | 0.01% |
| Mercer | 5 | 8 | 18 | 20 | 51 | 0.26% |
| Mifflin | 3 | 0 | 1 | 0 | 4 | 0.02% |
| Monroe | 4 | 0 | 1 | 1 | 6 | 0.03% |
| Montgomery | 849 | 719 | 673 | 686 | 2,927 | 15.16% |
| Montour | 0 | 0 | 2 | 0 | 2 | 0.01% |
| Northampton | 407 | 330 | 347 | 280 | 1,364 | 7.07% |
| Northumberland | 6 | 1 | 5 | 23 | 35 | 0.18% |
| Perry | 2 | 2 | 0 | 1 | 5 | 0.03% |
| Philadelphia | 21 | 3 | 9 | 13 | 46 | 0.24% |
| Pike | 4 | 13 | 27 | 27 | 71 | 0.37% |
| Schuylkill | 0 | 5 | 5 | 5 | 15 | 0.08% |
| Snyder | 0 | 0 | 1 | 0 | 1 | 0.01% |
| Somerset | 31 | 44 | 37 | 17 | 129 | 0.67% |
| Tioga | 0 | 0 | 2 | 0 | 2 | 0.01% |
| Union | 6 | 14 | 13 | 16 | 49 | 0.25% |
| Venango | 40 | 20 | 33 | 25 | 118 | 0.61% |
| Warren | 6 | 1 | 12 | 2 | 21 | 0.11% |
| Washington | 99 | 111 | 98 | 85 | 393 | 2.04% |
| Wayne | 1 | 0 | 0 | 0 | 1 | 0.01% |
| Westmoreland | 100 | 97 | 65 | 44 | 306 | 1.59% |
| Wyoming | 0 | 0 | 3 | 1 | 4 | 0.02% |
| York | 63 | 79 | 71 | 63 | 276 | 1.43% |
| Grand Total | 7,729 | 7,418 | 6,346 | 6,507 | 28,000 | N/A |