News
Underage Drinking Citations in Pennsylvania Declining

September 27, 2017
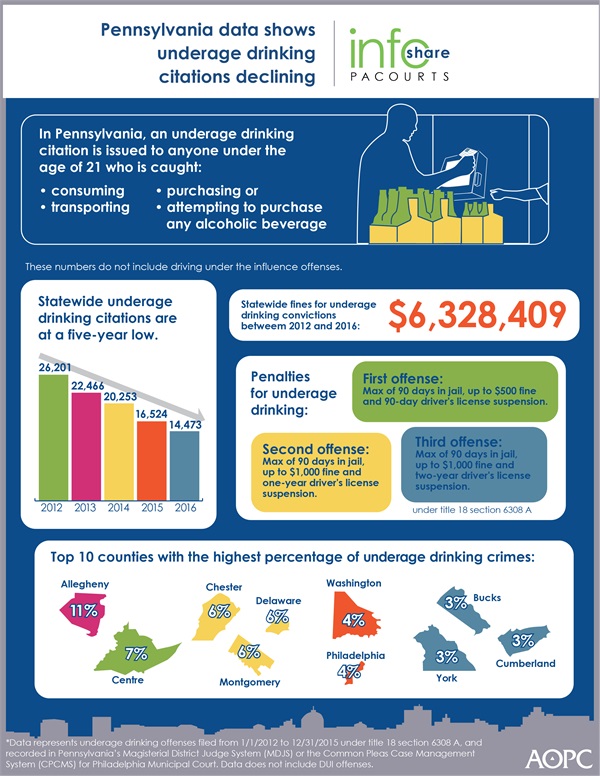
Underage drinking citations statewide have decreased by 45 percent between 2012 and 2016. In Pennsylvania an underage drinking citation is issued to anyone under the age of 21 who is caught consuming, transporting, purchasing or attempting to purchase any alcoholic beverage. These numbers do not include driving under the influence offenses.
Data is based on the following state law: Title 18, section 6308 A. The infographic below highlights key data and demographics about underage drinking in Pennsylvania. Or download a high-resolution file of the graphic.
County-specific data is available at the end of the news release.
PA Courts InfoShare is a monthly product of the Administrative Office of Pennsylvania Courts (AOPC) that visually highlights the work of the courts with interesting data and statistics obtained through the judiciary’s case management systems, interactive dashboards and other research. Reproduction is encouraged with source cited.
##
Media contact: Kim Bathgate, 717-231-3331
Editor’s Note:
County-specific underage drinking data
| Title 18 Section 6308 A (Purch Etc Alcoh Bev By A Minor) offenses filed from 1/1/2012 through 12/31/2016, as recorded in the Magisterial District Judge System (MDJS) and Common Pleas Case Management System (CPCMS) for Philadelphia Municipal Court. | |||||||
| County | 2012 | 2013 | 2014 | 2015 | 2016 | Total | Percentage of Overall |
| Adams | 273 | 251 | 216 | 145 | 133 | 1,018 | 1.02% |
| Allegheny | 2,738 | 2,404 | 2,041 | 1,720 | 1,567 | 10,470 | 10.48% |
| Armstrong | 89 | 83 | 106 | 67 | 72 | 417 | 0.42% |
| Beaver | 236 | 171 | 120 | 166 | 130 | 823 | 0.82% |
| Bedford | 42 | 76 | 34 | 28 | 15 | 195 | 0.20% |
| Berks | 654 | 641 | 667 | 440 | 418 | 2,820 | 2.82% |
| Blair | 434 | 352 | 370 | 241 | 335 | 1,732 | 1.73% |
| Bradford | 69 | 108 | 55 | 60 | 89 | 381 | 0.38% |
| Bucks | 1,034 | 735 | 646 | 491 | 367 | 3,273 | 3.28% |
| Butler | 391 | 341 | 370 | 361 | 370 | 1,833 | 1.83% |
| Cambria | 223 | 255 | 169 | 150 | 81 | 878 | 0.88% |
| Cameron | 3 | 6 | 2 | 1 | 4 | 16 | 0.02% |
| Carbon | 84 | 54 | 102 | 33 | 35 | 308 | 0.31% |
| Centre | 1,597 | 1,388 | 1,502 | 1,285 | 1,305 | 7,077 | 7.08% |
| Chester | 1,425 | 1,271 | 1,365 | 1,025 | 934 | 6,020 | 6.03% |
| Clarion | 198 | 111 | 116 | 111 | 83 | 619 | 0.62% |
| Clearfield | 86 | 77 | 58 | 66 | 65 | 352 | 0.35% |
| Clinton | 185 | 124 | 97 | 124 | 101 | 631 | 0.63% |
| Columbia | 718 | 561 | 465 | 497 | 479 | 2,720 | 2.72% |
| Crawford | 179 | 121 | 129 | 104 | 90 | 623 | 0.62% |
| Cumberland | 778 | 800 | 533 | 480 | 479 | 3,070 | 3.07% |
| Dauphin | 541 | 496 | 354 | 338 | 347 | 2,076 | 2.08% |
| Delaware | 1,601 | 1,338 | 1,185 | 856 | 654 | 5,634 | 5.64% |
| Elk | 89 | 44 | 39 | 22 | 26 | 220 | 0.22% |
| Erie | 748 | 626 | 462 | 336 | 314 | 2,486 | 2.49% |
| Fayette | 126 | 118 | 129 | 108 | 78 | 559 | 0.56% |
| Forest | 8 | 5 | 4 | 3 | 3 | 23 | 0.02% |
| Franklin | 190 | 154 | 126 | 116 | 91 | 677 | 0.68% |
| Fulton | 14 | 10 | 10 | 11 | 15 | 60 | 0.06% |
| Greene | 50 | 22 | 25 | 25 | 19 | 141 | 0.14% |
| Huntingdon | 63 | 63 | 38 | 29 | 32 | 225 | 0.23% |
| Indiana | 729 | 602 | 648 | 433 | 444 | 2,856 | 2.86% |
| Jefferson | 82 | 89 | 90 | 39 | 27 | 327 | 0.33% |
| Juniata | 22 | 20 | 20 | 5 | 11 | 78 | 0.08% |
| Lackawanna | 539 | 310 | 351 | 317 | 266 | 1,783 | 1.78% |
| Lancaster | 723 | 563 | 442 | 400 | 365 | 2,493 | 2.50% |
| Lawrence | 153 | 94 | 68 | 69 | 61 | 445 | 0.45% |
| Lebanon | 262 | 116 | 120 | 114 | 114 | 726 | 0.73% |
| Lehigh | 500 | 347 | 288 | 215 | 193 | 1,543 | 1.54% |
| Luzerne | 687 | 518 | 470 | 364 | 238 | 2,277 | 2.28% |
| Lycoming | 315 | 236 | 220 | 172 | 139 | 1,082 | 1.08% |
| McKean | 97 | 83 | 80 | 83 | 40 | 383 | 0.38% |
| Mercer | 205 | 145 | 157 | 80 | 68 | 655 | 0.66% |
| Mifflin | 56 | 67 | 55 | 40 | 51 | 269 | 0.27% |
| Monroe | 414 | 318 | 269 | 248 | 166 | 1,415 | 1.42% |
| Montgomery | 1,573 | 1,427 | 1,300 | 1,023 | 854 | 6,177 | 6.18% |
| Montour | 7 | 9 | 22 | 17 | 6 | 61 | 0.06% |
| Northampton | 767 | 558 | 498 | 353 | 387 | 2,563 | 2.57% |
| Northumberland | 193 | 128 | 97 | 111 | 71 | 600 | 0.60% |
| Perry | 81 | 47 | 18 | 12 | 9 | 167 | 0.17% |
| Philadelphia | 758 | 1,322 | 988 | 674 | 533 | 4,275 | 4.28% |
| Pike | 98 | 35 | 96 | 67 | 17 | 313 | 0.31% |
| Potter | 26 | 13 | 20 | 29 | 28 | 116 | 0.12% |
| Schuylkill | 281 | 236 | 169 | 82 | 67 | 835 | 0.84% |
| Snyder | 73 | 61 | 47 | 23 | 38 | 242 | 0.24% |
| Somerset | 92 | 78 | 25 | 30 | 17 | 242 | 0.24% |
| Sullivan | 9 | 5 | 0 | 1 | 1 | 16 | 0.02% |
| Susquehanna | 53 | 40 | 32 | 14 | 8 | 147 | 0.15% |
| Tioga | 81 | 102 | 87 | 85 | 45 | 400 | 0.40% |
| Union | 192 | 173 | 131 | 162 | 159 | 817 | 0.82% |
| Venango | 86 | 56 | 30 | 34 | 25 | 231 | 0.23% |
| Warren | 40 | 48 | 48 | 57 | 28 | 221 | 0.22% |
| Washington | 815 | 686 | 779 | 770 | 587 | 3,637 | 3.64% |
| Wayne | 44 | 34 | 43 | 45 | 7 | 173 | 0.17% |
| Westmoreland | 355 | 312 | 355 | 238 | 250 | 1,510 | 1.51% |
| Wyoming | 25 | 24 | 17 | 33 | 16 | 115 | 0.12% |
| York | 902 | 758 | 638 | 646 | 406 | 3,350 | 3.35% |
| Grand Total | 26,201 | 22,466 | 20,253 | 16,524 | 14,473 | 99,917 | 100.00% |