
News
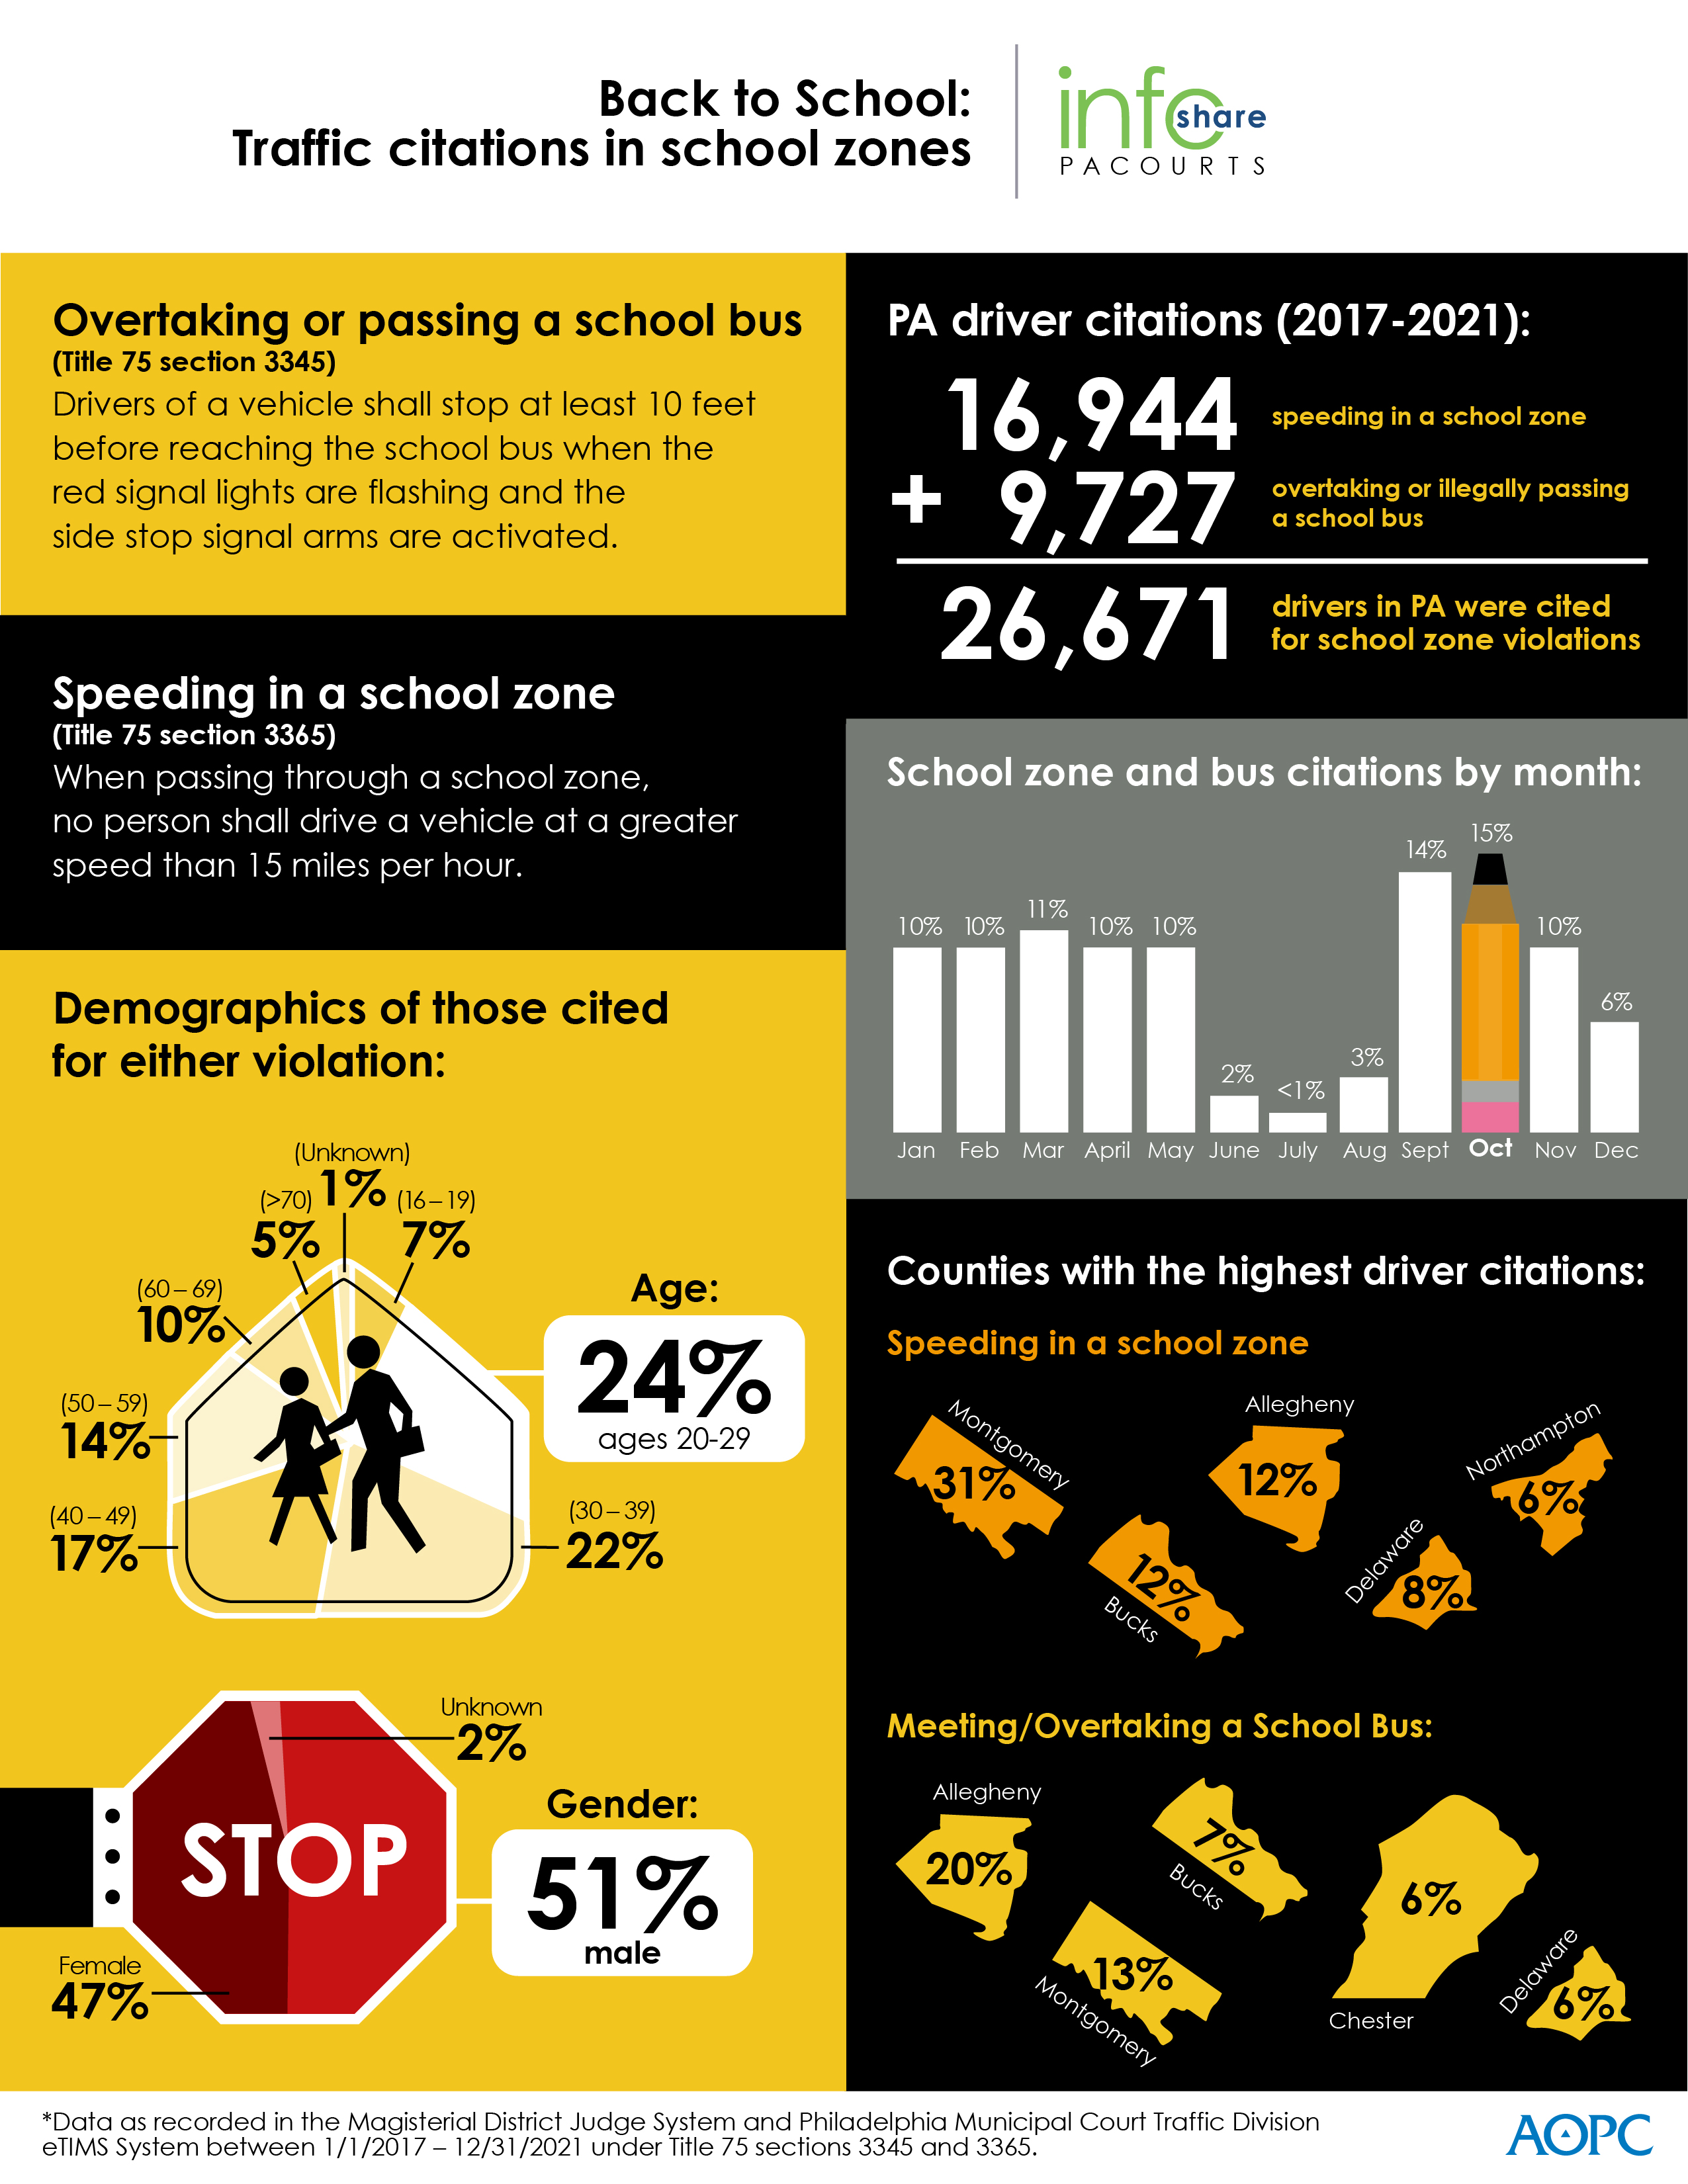
Back-to-School is just around the corner -- Beware of school zone safety and traffic citations

August 12, 2022
In Pennsylvania, two school zone traffic laws have been cited more than 26,671 times over the past five years (2017-2021). The infographic below highlights key data and demographics about speeding in school zones or illegally passing a school bus.
Download a high-resolution version of the graphic. County-level detail is provided at the end of the release.
|
Section / Offense Description |
Filed Year |
Total |
% of Overall |
||||
|
2017 |
2018 |
2019 |
2020 |
2021 |
|||
|
3345 /Overtaking School Bus |
2,291 |
2,283 |
2,660 |
990 |
1,503 |
9,727 |
N/A |
|
Adams |
31 |
4 |
13 |
7 |
8 |
63 |
0.65% |
|
Allegheny |
453 |
433 |
564 |
169 |
294 |
1,913 |
19.67% |
|
Armstrong |
4 |
8 |
5 |
1 |
4 |
22 |
0.23% |
|
Beaver |
28 |
15 |
9 |
4 |
16 |
72 |
0.74% |
|
Bedford |
0 |
3 |
5 |
8 |
6 |
22 |
0.23% |
|
Berks |
149 |
122 |
84 |
23 |
39 |
417 |
4.29% |
|
Blair |
14 |
5 |
14 |
9 |
8 |
50 |
0.51% |
|
Bradford |
1 |
7 |
4 |
3 |
8 |
23 |
0.24% |
|
Bucks |
200 |
169 |
196 |
45 |
71 |
681 |
7.00% |
|
Butler |
38 |
64 |
82 |
59 |
61 |
304 |
3.13% |
|
Cambria |
21 |
17 |
11 |
6 |
21 |
76 |
0.78% |
|
Cameron |
2 |
0 |
0 |
0 |
0 |
2 |
0.02% |
|
Carbon |
10 |
6 |
5 |
1 |
6 |
28 |
0.29% |
|
Centre |
50 |
31 |
40 |
7 |
16 |
144 |
1.48% |
|
Chester |
161 |
155 |
153 |
50 |
75 |
594 |
6.11% |
|
Clarion |
7 |
7 |
4 |
1 |
4 |
23 |
0.24% |
|
Clearfield |
3 |
7 |
4 |
4 |
2 |
20 |
0.21% |
|
Clinton |
2 |
2 |
8 |
1 |
0 |
13 |
0.13% |
|
Columbia |
13 |
14 |
23 |
6 |
8 |
64 |
0.66% |
|
Crawford |
9 |
9 |
4 |
3 |
3 |
28 |
0.29% |
|
Cumberland |
26 |
30 |
33 |
16 |
29 |
134 |
1.38% |
|
Dauphin |
86 |
63 |
62 |
23 |
35 |
269 |
2.77% |
|
Delaware |
119 |
125 |
193 |
58 |
96 |
591 |
6.08% |
|
Elk |
1 |
3 |
3 |
0 |
3 |
10 |
0.10% |
|
Erie |
42 |
49 |
46 |
24 |
53 |
214 |
2.20% |
|
Fayette |
11 |
5 |
9 |
4 |
5 |
34 |
0.35% |
|
Forest |
0 |
0 |
0 |
0 |
1 |
1 |
0.01% |
|
Franklin |
9 |
7 |
12 |
4 |
9 |
41 |
0.42% |
|
Fulton |
1 |
4 |
1 |
2 |
0 |
8 |
0.08% |
|
Greene |
4 |
0 |
7 |
0 |
1 |
12 |
0.12% |
|
Huntingdon |
2 |
2 |
3 |
2 |
0 |
9 |
0.09% |
|
Indiana |
3 |
5 |
13 |
3 |
1 |
25 |
0.26% |
|
Jefferson |
7 |
5 |
8 |
3 |
4 |
27 |
0.28% |
|
Juniata |
2 |
2 |
1 |
0 |
1 |
6 |
0.06% |
|
Lackawanna |
44 |
39 |
21 |
8 |
13 |
125 |
1.29% |
|
Lancaster |
60 |
75 |
80 |
41 |
55 |
311 |
3.20% |
|
Lawrence |
4 |
9 |
6 |
1 |
5 |
25 |
0.26% |
|
Lebanon |
12 |
6 |
7 |
2 |
6 |
33 |
0.34% |
|
Lehigh |
70 |
60 |
64 |
29 |
93 |
316 |
3.25% |
|
Luzerne |
18 |
36 |
53 |
14 |
27 |
148 |
1.52% |
|
Lycoming |
12 |
7 |
12 |
6 |
3 |
40 |
0.41% |
|
McKean |
2 |
4 |
2 |
3 |
3 |
14 |
0.14% |
|
Mercer |
14 |
9 |
7 |
5 |
5 |
40 |
0.41% |
|
Mifflin |
7 |
9 |
10 |
1 |
15 |
42 |
0.43% |
|
Monroe |
18 |
12 |
20 |
10 |
15 |
75 |
0.77% |
|
Montgomery |
218 |
333 |
378 |
160 |
193 |
1,282 |
13.18% |
|
Montour |
0 |
0 |
2 |
0 |
3 |
5 |
0.05% |
|
Northampton |
52 |
34 |
56 |
20 |
33 |
195 |
2.00% |
|
Northumberland |
5 |
11 |
10 |
11 |
8 |
45 |
0.46% |
|
Philadelphia |
71 |
64 |
68 |
23 |
8 |
234 |
2.41% |
|
Perry |
6 |
3 |
2 |
1 |
1 |
13 |
0.13% |
|
Pike |
4 |
2 |
1 |
2 |
2 |
11 |
0.11% |
|
Potter |
0 |
2 |
2 |
2 |
2 |
8 |
0.08% |
|
Schuylkill |
29 |
14 |
15 |
8 |
16 |
82 |
0.84% |
|
Snyder |
1 |
2 |
8 |
4 |
3 |
18 |
0.19% |
|
Somerset |
4 |
1 |
3 |
0 |
2 |
10 |
0.10% |
|
Sullivan |
2 |
0 |
1 |
0 |
0 |
3 |
0.03% |
|
Susquehanna |
3 |
3 |
3 |
1 |
1 |
11 |
0.11% |
|
Tioga |
1 |
1 |
3 |
4 |
2 |
11 |
0.11% |
|
Union |
1 |
3 |
6 |
1 |
4 |
15 |
0.15% |
|
Venango |
11 |
15 |
7 |
5 |
11 |
49 |
0.50% |
|
Warren |
2 |
1 |
2 |
2 |
1 |
8 |
0.08% |
|
Washington |
25 |
24 |
35 |
14 |
9 |
107 |
1.10% |
|
Wayne |
3 |
0 |
9 |
2 |
2 |
16 |
0.16% |
|
Westmoreland |
21 |
36 |
32 |
21 |
16 |
126 |
1.30% |
|
Wyoming |
9 |
4 |
9 |
7 |
4 |
33 |
0.34% |
|
York |
53 |
86 |
107 |
36 |
54 |
336 |
3.45% |
|
3365 / Speeding In School Zone |
3,651 |
3,530 |
5,014 |
1,933 |
2,816 |
16,944 |
N/A |
|
Adams |
76 |
52 |
62 |
38 |
21 |
249 |
1.47% |
|
Allegheny |
714 |
453 |
482 |
181 |
133 |
1,963 |
11.59% |
|
Armstrong |
1 |
2 |
0 |
0 |
8 |
11 |
0.06% |
|
Beaver |
74 |
54 |
106 |
54 |
98 |
386 |
2.28% |
|
Bedford |
1 |
2 |
3 |
1 |
0 |
7 |
0.04% |
|
Berks |
114 |
119 |
130 |
37 |
90 |
490 |
2.89% |
|
Blair |
22 |
17 |
4 |
1 |
5 |
49 |
0.29% |
|
Bucks |
440 |
507 |
553 |
197 |
275 |
1,972 |
11.64% |
|
Butler |
35 |
28 |
34 |
12 |
14 |
123 |
0.73% |
|
Cambria |
16 |
16 |
17 |
13 |
11 |
73 |
0.43% |
|
Cameron |
0 |
1 |
0 |
1 |
1 |
3 |
0.02% |
|
Carbon |
2 |
15 |
19 |
4 |
2 |
42 |
0.25% |
|
Centre |
7 |
7 |
2 |
2 |
7 |
25 |
0.15% |
|
Chester |
149 |
174 |
146 |
27 |
59 |
555 |
3.28% |
|
Clarion |
6 |
1 |
0 |
0 |
0 |
7 |
0.04% |
|
Clearfield |
1 |
2 |
0 |
0 |
0 |
3 |
0.02% |
|
Clinton |
17 |
0 |
2 |
1 |
0 |
20 |
0.12% |
|
Columbia |
0 |
1 |
1 |
1 |
0 |
3 |
0.02% |
|
Crawford |
16 |
26 |
8 |
4 |
0 |
54 |
0.32% |
|
Cumberland |
32 |
37 |
69 |
18 |
26 |
182 |
1.07% |
|
Dauphin |
39 |
23 |
41 |
39 |
21 |
163 |
0.96% |
|
Delaware |
271 |
231 |
532 |
71 |
249 |
1,354 |
7.99% |
|
Elk |
6 |
6 |
1 |
1 |
1 |
15 |
0.09% |
|
Erie |
65 |
90 |
133 |
112 |
128 |
528 |
3.12% |
|
Fayette |
4 |
0 |
1 |
1 |
1 |
7 |
0.04% |
|
Franklin |
13 |
22 |
56 |
45 |
33 |
169 |
1.00% |
|
Fulton |
1 |
2 |
1 |
2 |
2 |
8 |
0.05% |
|
Greene |
9 |
1 |
1 |
1 |
14 |
26 |
0.15% |
|
Huntingdon |
0 |
0 |
2 |
1 |
0 |
3 |
0.02% |
|
Indiana |
3 |
7 |
0 |
4 |
11 |
25 |
0.15% |
|
Jefferson |
0 |
1 |
5 |
10 |
13 |
29 |
0.17% |
|
Juniata |
0 |
0 |
0 |
0 |
2 |
2 |
0.01% |
|
Lackawanna |
11 |
19 |
22 |
1 |
20 |
73 |
0.43% |
|
Lancaster |
17 |
12 |
19 |
26 |
135 |
209 |
1.23% |
|
Lawrence |
12 |
3 |
3 |
0 |
1 |
19 |
0.11% |
|
Lebanon |
28 |
17 |
54 |
17 |
16 |
132 |
0.78% |
|
Lehigh |
32 |
22 |
74 |
16 |
9 |
153 |
0.90% |
|
Luzerne |
35 |
76 |
33 |
15 |
85 |
244 |
1.44% |
|
Lycoming |
19 |
20 |
17 |
0 |
0 |
56 |
0.33% |
|
McKean |
0 |
2 |
2 |
0 |
2 |
6 |
0.04% |
|
Mercer |
6 |
40 |
23 |
2 |
33 |
104 |
0.61% |
|
Monroe |
0 |
0 |
0 |
0 |
4 |
4 |
0.02% |
|
Montgomery |
790 |
1,011 |
1,833 |
742 |
932 |
5,308 |
31.33% |
|
Montour |
1 |
0 |
0 |
0 |
1 |
2 |
0.01% |
|
Northampton |
247 |
191 |
262 |
115 |
155 |
970 |
5.72% |
|
Northumberland |
6 |
3 |
0 |
1 |
4 |
14 |
0.08% |
|
Philadelphia |
5 |
3 |
5 |
0 |
1 |
14 |
0.08% |
|
Potter |
0 |
0 |
7 |
0 |
0 |
7 |
0.04% |
|
Schuylkill |
23 |
15 |
14 |
1 |
0 |
53 |
0.31% |
|
Snyder |
0 |
0 |
0 |
0 |
2 |
2 |
0.01% |
|
Somerset |
52 |
27 |
9 |
2 |
1 |
91 |
0.54% |
|
Tioga |
0 |
3 |
0 |
0 |
0 |
3 |
0.02% |
|
Union |
38 |
8 |
11 |
9 |
2 |
68 |
0.40% |
|
Venango |
22 |
19 |
17 |
9 |
76 |
143 |
0.84% |
|
Warren |
9 |
0 |
0 |
1 |
0 |
10 |
0.06% |
|
Washington |
24 |
31 |
30 |
13 |
44 |
142 |
0.84% |
|
Wayne |
0 |
1 |
0 |
0 |
0 |
1 |
0.01% |
|
Westmoreland |
94 |
107 |
125 |
61 |
59 |
446 |
2.63% |
|
Wyoming |
0 |
2 |
1 |
0 |
0 |
3 |
0.02% |
|
York |
46 |
1 |
42 |
23 |
9 |
121 |
0.71% |
|
Grand Total |
5,942 |
5,813 |
7,674 |
2,923 |
4,319 |
26,671 |
N/A |
PA Courts InfoShare is a monthly product of the Administrative Office of Pennsylvania Courts (AOPC) that visually highlights the work of the courts with interesting data and statistics obtained through the judiciary’s case management systems, interactive dashboards and other research. Reproduction is permissible with source cited.
##
Media contact: Kimberly Bathgate, 717-231-3331