
News
Retail Theft Charges Hit Five-Year High in Pennsylvania

December 12, 2025
Retail theft offenses in Pennsylvania increased by 16% from 2023 to 2024, hitting a five-year high.
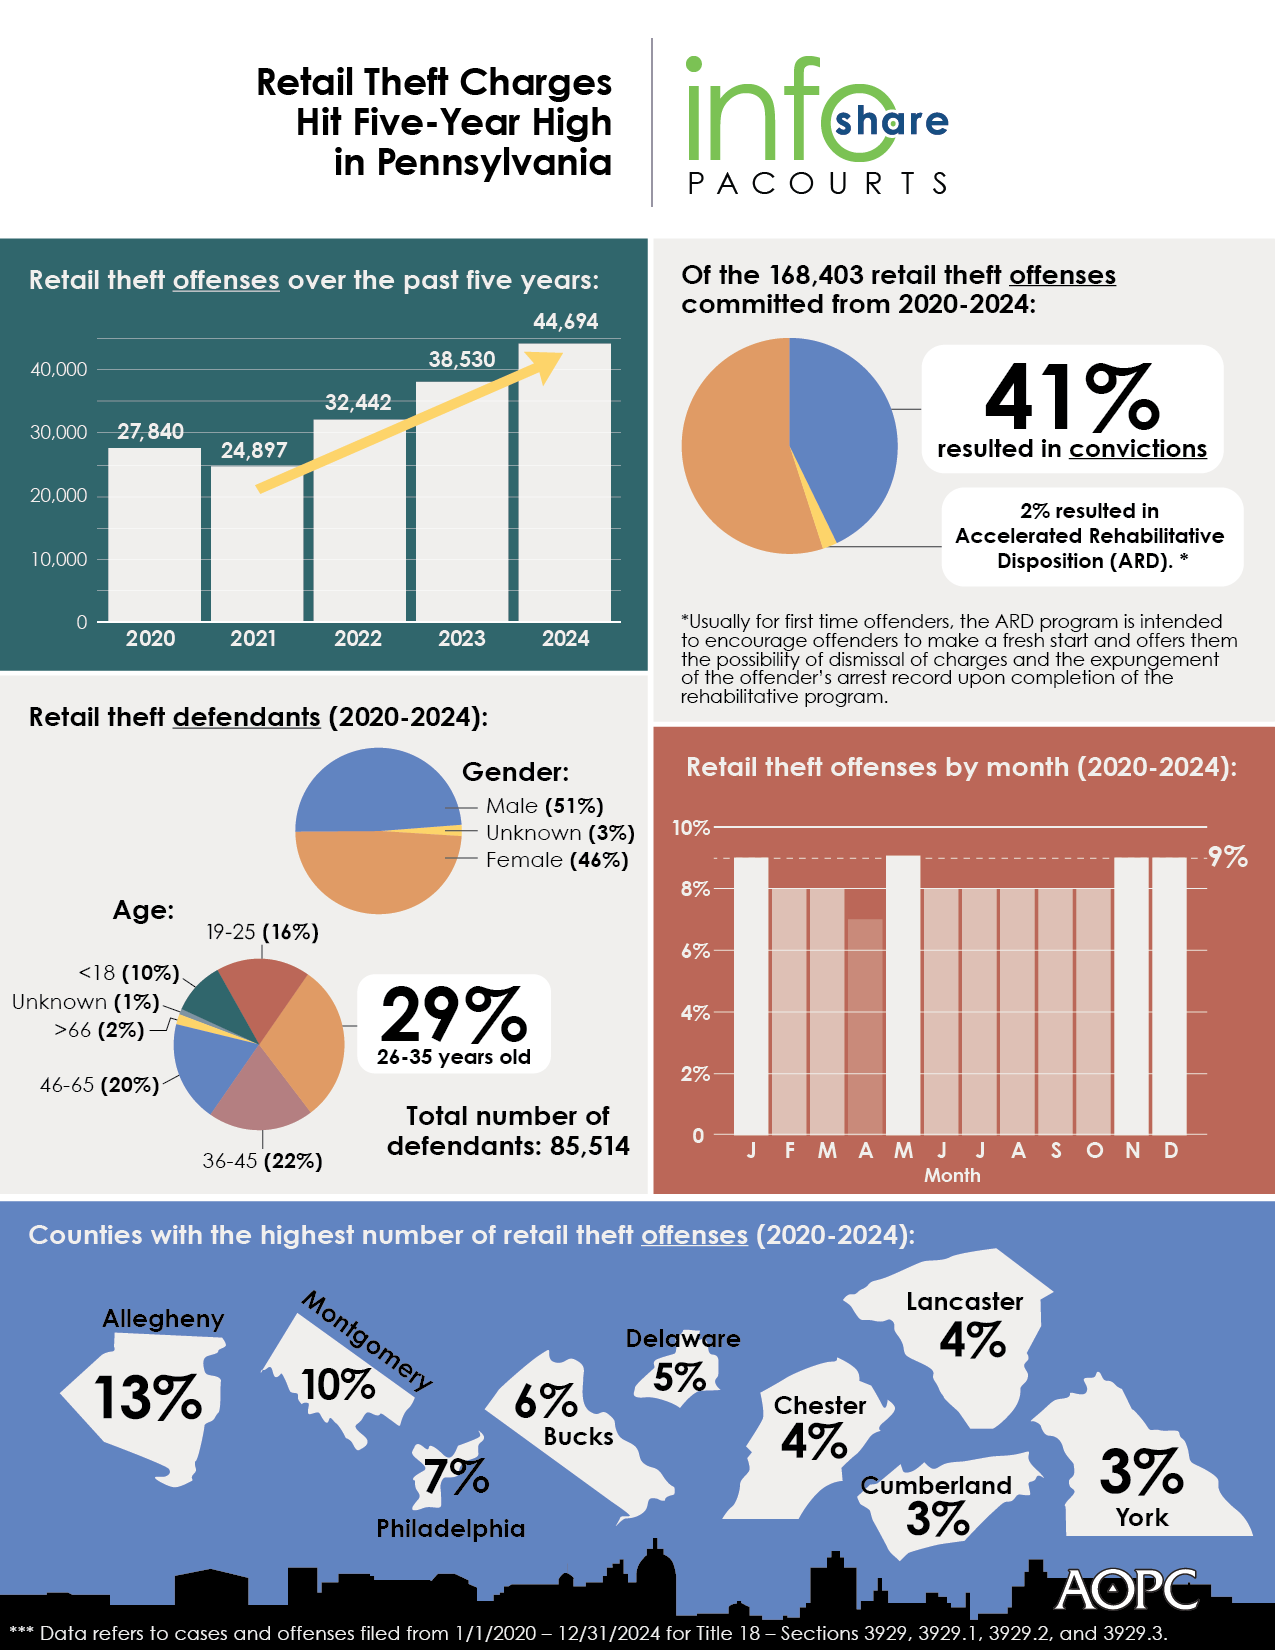
The infographic highlights retail theft data from 2020 to 2024 including the statewide number of retail theft offenses by month, the top 10 counties with the highest number of retail theft offenses and statewide defendant demographics.
A high-resolution file of the graphic is available for download at www.pacourts.us under Media Resources.
PA Courts InfoShare is a monthly product of the Administrative Office of Pennsylvania Courts (AOPC) that visually highlights the work of the courts with interesting data and statistics obtained through the judiciary’s case management systems, interactive dashboards and other research. Reproduction is permissible with source cited.
##
Media contact: Olivia Antonucci, 609-238-5182
Editor’s Note: County-by-county retail theft offenses filed from 1/1/2020-12/31/2024.
|
Statewide number of offenses filed from 1/1/2020 through 12/31/2024 for Title 18 - Sections 3929, 3929.1, 3929.2, and 3929.3, as recorded in the Magisterial District Judge System (MDJS) and Common Pleas Case Management System (CPCMS); Grouped by County and Section |
|||||||
|
Row Labels |
2020 |
2021 |
2022 |
2023 |
2024 |
Grand Total |
Percentage of Total |
|
Adams |
81 |
56 |
133 |
104 |
90 |
464 |
0.28% |
|
3929 |
79 |
56 |
133 |
104 |
90 |
462 |
0.27% |
|
3929.1 |
2 |
0 |
0 |
0 |
0 |
2 |
0.00% |
|
Allegheny |
3,258 |
2,697 |
3,795 |
5,273 |
6,229 |
21,252 |
12.62% |
|
3929 |
3,244 |
2,683 |
3,779 |
5,247 |
6,182 |
21,135 |
12.55% |
|
3929.1 |
1 |
0 |
1 |
0 |
0 |
2 |
0.00% |
|
3929.2 |
0 |
0 |
0 |
8 |
9 |
17 |
0.01% |
|
3929.3 |
13 |
14 |
15 |
18 |
38 |
98 |
0.06% |
|
Armstrong |
143 |
30 |
101 |
77 |
82 |
433 |
0.26% |
|
3929 |
143 |
30 |
101 |
77 |
82 |
433 |
0.26% |
|
Beaver |
588 |
370 |
520 |
591 |
977 |
3,046 |
1.81% |
|
3929 |
587 |
370 |
520 |
591 |
973 |
3,041 |
1.81% |
|
3929.2 |
1 |
0 |
0 |
0 |
1 |
2 |
0.00% |
|
3929.3 |
0 |
0 |
0 |
0 |
3 |
3 |
0.00% |
|
Bedford |
50 |
36 |
50 |
38 |
49 |
223 |
0.13% |
|
3929 |
50 |
36 |
50 |
38 |
49 |
223 |
0.13% |
|
Berks |
774 |
700 |
1,016 |
1,248 |
1,239 |
4,977 |
2.96% |
|
3929 |
773 |
699 |
1,016 |
1,237 |
1,233 |
4,958 |
2.94% |
|
3929.2 |
1 |
1 |
0 |
0 |
0 |
2 |
0.00% |
|
3929.3 |
0 |
0 |
0 |
11 |
6 |
17 |
0.01% |
|
Blair |
396 |
356 |
423 |
444 |
733 |
2,352 |
1.40% |
|
3929 |
396 |
356 |
423 |
444 |
733 |
2,352 |
1.40% |
|
Bradford |
151 |
140 |
118 |
88 |
77 |
574 |
0.34% |
|
3929 |
151 |
140 |
118 |
88 |
77 |
574 |
0.34% |
|
Bucks |
1,432 |
1,461 |
1,993 |
2,236 |
2,632 |
9,754 |
5.79% |
|
3929 |
1,429 |
1,453 |
1,987 |
2,223 |
2,621 |
9,713 |
5.77% |
|
3929.1 |
0 |
5 |
0 |
0 |
1 |
6 |
0.00% |
|
3929.2 |
3 |
3 |
3 |
4 |
3 |
16 |
0.01% |
|
3929.3 |
0 |
0 |
3 |
9 |
7 |
19 |
0.01% |
|
Butler |
520 |
572 |
700 |
743 |
762 |
3,297 |
1.96% |
|
3929 |
519 |
568 |
700 |
741 |
750 |
3,278 |
1.95% |
|
3929.2 |
1 |
0 |
0 |
0 |
0 |
1 |
0.00% |
|
3929.3 |
0 |
4 |
0 |
2 |
12 |
18 |
0.01% |
|
Cambria |
239 |
141 |
251 |
482 |
456 |
1,569 |
0.93% |
|
3929 |
239 |
141 |
251 |
482 |
456 |
1,569 |
0.93% |
|
Cameron |
2 |
2 |
6 |
4 |
2 |
16 |
0.01% |
|
3929 |
2 |
2 |
5 |
4 |
2 |
15 |
0.01% |
|
3929.3 |
0 |
0 |
1 |
0 |
0 |
1 |
0.00% |
|
Carbon |
145 |
91 |
62 |
145 |
93 |
536 |
0.32% |
|
3929 |
145 |
91 |
62 |
145 |
93 |
536 |
0.32% |
|
Centre |
340 |
121 |
505 |
442 |
350 |
1,758 |
1.04% |
|
3929 |
340 |
121 |
505 |
442 |
350 |
1,758 |
1.04% |
|
Chester |
962 |
1,129 |
1,214 |
1,715 |
1,368 |
6,388 |
3.79% |
|
3929 |
956 |
1,119 |
1,211 |
1,715 |
1,358 |
6,359 |
3.78% |
|
3929.2 |
3 |
1 |
2 |
0 |
0 |
6 |
0.00% |
|
3929.3 |
3 |
9 |
1 |
0 |
10 |
23 |
0.01% |
|
Clarion |
52 |
60 |
48 |
72 |
93 |
325 |
0.19% |
|
3929 |
52 |
60 |
48 |
72 |
93 |
325 |
0.19% |
|
Clearfield |
197 |
167 |
206 |
127 |
173 |
870 |
0.52% |
|
3929 |
196 |
167 |
206 |
127 |
173 |
869 |
0.52% |
|
3929.3 |
1 |
0 |
0 |
0 |
0 |
1 |
0.00% |
|
Clinton |
82 |
40 |
63 |
80 |
133 |
398 |
0.24% |
|
3929 |
82 |
40 |
63 |
80 |
133 |
398 |
0.24% |
|
Columbia |
184 |
185 |
109 |
222 |
161 |
861 |
0.51% |
|
3929 |
184 |
185 |
109 |
222 |
161 |
861 |
0.51% |
|
Crawford |
139 |
148 |
250 |
141 |
288 |
966 |
0.57% |
|
3929 |
139 |
148 |
249 |
141 |
288 |
965 |
0.57% |
|
3929.1 |
0 |
0 |
1 |
0 |
0 |
1 |
0.00% |
|
Cumberland |
860 |
989 |
1,089 |
1,045 |
1,403 |
5,386 |
3.20% |
|
3929 |
854 |
988 |
1,074 |
1,003 |
1,366 |
5,285 |
3.14% |
|
3929.1 |
0 |
0 |
1 |
0 |
0 |
1 |
0.00% |
|
3929.2 |
0 |
0 |
0 |
5 |
1 |
6 |
0.00% |
|
3929.3 |
6 |
1 |
14 |
37 |
36 |
94 |
0.06% |
|
Dauphin |
1,018 |
862 |
885 |
1,084 |
1,363 |
5,212 |
3.09% |
|
3929 |
1,018 |
859 |
881 |
1,083 |
1,352 |
5,193 |
3.08% |
|
3929.3 |
0 |
3 |
4 |
1 |
11 |
19 |
0.01% |
|
Delaware |
1,303 |
1,449 |
1,915 |
1,912 |
2,123 |
8,702 |
5.17% |
|
3929 |
1,291 |
1,442 |
1,822 |
1,910 |
2,116 |
8,581 |
5.10% |
|
3929.2 |
3 |
1 |
4 |
2 |
6 |
16 |
0.01% |
|
3929.3 |
9 |
6 |
89 |
0 |
1 |
105 |
0.06% |
|
Elk |
93 |
99 |
124 |
75 |
24 |
415 |
0.25% |
|
3929 |
93 |
99 |
124 |
75 |
24 |
415 |
0.25% |
|
Erie |
1,825 |
1,632 |
1,354 |
1,245 |
1,220 |
7,276 |
4.32% |
|
3929 |
1,825 |
1,632 |
1,354 |
1,245 |
1,217 |
7,273 |
4.32% |
|
3929.1 |
0 |
0 |
0 |
0 |
1 |
1 |
0.00% |
|
3929.2 |
0 |
0 |
0 |
0 |
2 |
2 |
0.00% |
|
Fayette |
395 |
293 |
417 |
529 |
570 |
2,204 |
1.31% |
|
3929 |
395 |
293 |
417 |
529 |
570 |
2,204 |
1.31% |
|
Forest |
0 |
5 |
2 |
0 |
2 |
9 |
0.01% |
|
3929 |
0 |
5 |
2 |
0 |
2 |
9 |
0.01% |
|
Franklin |
401 |
483 |
385 |
540 |
575 |
2,384 |
1.42% |
|
3929 |
401 |
483 |
385 |
540 |
575 |
2,384 |
1.42% |
|
Fulton |
14 |
8 |
15 |
17 |
17 |
71 |
0.04% |
|
3929 |
14 |
8 |
15 |
17 |
17 |
71 |
0.04% |
|
Greene |
71 |
36 |
62 |
74 |
78 |
321 |
0.19% |
|
3929 |
71 |
36 |
62 |
74 |
78 |
321 |
0.19% |
|
Huntingdon |
29 |
54 |
64 |
63 |
59 |
269 |
0.16% |
|
3929 |
29 |
54 |
64 |
63 |
59 |
269 |
0.16% |
|
Indiana |
306 |
154 |
166 |
236 |
241 |
1,103 |
0.65% |
|
3929 |
306 |
154 |
166 |
236 |
241 |
1,103 |
0.65% |
|
Jefferson |
43 |
20 |
27 |
29 |
22 |
141 |
0.08% |
|
3929 |
43 |
20 |
27 |
29 |
22 |
141 |
0.08% |
|
Juniata |
4 |
11 |
9 |
20 |
13 |
57 |
0.03% |
|
3929 |
4 |
11 |
9 |
20 |
13 |
57 |
0.03% |
|
Lackawanna |
339 |
269 |
392 |
435 |
440 |
1,875 |
1.11% |
|
3929 |
337 |
267 |
392 |
431 |
437 |
1,864 |
1.11% |
|
3929.2 |
2 |
1 |
0 |
0 |
3 |
6 |
0.00% |
|
3929.3 |
0 |
1 |
0 |
4 |
0 |
5 |
0.00% |
|
Lancaster |
782 |
858 |
1,174 |
1,503 |
1,684 |
6,001 |
3.56% |
|
3929 |
773 |
849 |
1,173 |
1,503 |
1,681 |
5,979 |
3.55% |
|
3929.1 |
0 |
1 |
0 |
0 |
0 |
1 |
0.00% |
|
3929.2 |
0 |
0 |
1 |
0 |
2 |
3 |
0.00% |
|
3929.3 |
9 |
8 |
0 |
0 |
1 |
18 |
0.01% |
|
Lawrence |
264 |
137 |
177 |
162 |
140 |
880 |
0.52% |
|
3929 |
264 |
137 |
177 |
161 |
139 |
878 |
0.52% |
|
3929.2 |
0 |
0 |
0 |
1 |
0 |
1 |
0.00% |
|
3929.3 |
0 |
0 |
0 |
0 |
1 |
1 |
0.00% |
|
Lebanon |
376 |
176 |
175 |
297 |
255 |
1,279 |
0.76% |
|
3929 |
376 |
176 |
175 |
297 |
255 |
1,279 |
0.76% |
|
Lehigh |
609 |
485 |
762 |
1,038 |
1,315 |
4,209 |
2.50% |
|
3929 |
608 |
485 |
762 |
1,037 |
1,314 |
4,206 |
2.50% |
|
3929.2 |
1 |
0 |
0 |
0 |
1 |
2 |
0.00% |
|
3929.3 |
0 |
0 |
0 |
1 |
0 |
1 |
0.00% |
|
Luzerne |
802 |
570 |
757 |
888 |
963 |
3,980 |
2.36% |
|
3929 |
797 |
570 |
757 |
888 |
957 |
3,969 |
2.36% |
|
3929.2 |
0 |
0 |
0 |
0 |
4 |
4 |
0.00% |
|
3929.3 |
5 |
0 |
0 |
0 |
2 |
7 |
0.00% |
|
Lycoming |
213 |
163 |
192 |
266 |
240 |
1,074 |
0.64% |
|
3929 |
213 |
163 |
192 |
265 |
240 |
1,073 |
0.64% |
|
3929.2 |
0 |
0 |
0 |
1 |
0 |
1 |
0.00% |
|
McKean |
58 |
75 |
185 |
144 |
137 |
599 |
0.36% |
|
3929 |
58 |
75 |
185 |
144 |
137 |
599 |
0.36% |
|
Mercer |
444 |
264 |
322 |
366 |
277 |
1,673 |
0.99% |
|
3929 |
444 |
263 |
319 |
366 |
276 |
1,668 |
0.99% |
|
3929.2 |
0 |
1 |
3 |
0 |
1 |
5 |
0.00% |
|
Mifflin |
62 |
63 |
97 |
135 |
131 |
488 |
0.29% |
|
3929 |
62 |
63 |
97 |
135 |
131 |
488 |
0.29% |
|
Monroe |
570 |
490 |
655 |
860 |
951 |
3,526 |
2.09% |
|
3929 |
562 |
489 |
651 |
860 |
944 |
3,506 |
2.08% |
|
3929.3 |
8 |
1 |
4 |
0 |
7 |
20 |
0.01% |
|
Montgomery |
1,835 |
2,057 |
3,510 |
4,365 |
4,740 |
16,507 |
9.80% |
|
3929 |
1,820 |
2,043 |
3,407 |
4,087 |
4,651 |
16,008 |
9.51% |
|
3929.2 |
15 |
8 |
13 |
23 |
18 |
77 |
0.05% |
|
3929.3 |
0 |
6 |
90 |
255 |
71 |
422 |
0.25% |
|
Montour |
17 |
18 |
7 |
25 |
10 |
77 |
0.05% |
|
3929 |
17 |
18 |
7 |
25 |
10 |
77 |
0.05% |
|
Northampton |
330 |
257 |
438 |
534 |
597 |
2,156 |
1.28% |
|
3929 |
330 |
257 |
438 |
534 |
597 |
2,156 |
1.28% |
|
Northumberland |
147 |
99 |
93 |
183 |
160 |
682 |
0.40% |
|
3929 |
147 |
99 |
93 |
183 |
160 |
682 |
0.40% |
|
Perry |
58 |
27 |
7 |
33 |
27 |
152 |
0.09% |
|
3929 |
58 |
27 |
7 |
33 |
27 |
152 |
0.09% |
|
Philadelphia |
1,866 |
1,393 |
1,751 |
1,953 |
4,303 |
11,266 |
6.69% |
|
3929 |
1,865 |
1,393 |
1,748 |
1,919 |
4,250 |
11,175 |
6.64% |
|
3929.1 |
0 |
0 |
1 |
0 |
0 |
1 |
0.00% |
|
3929.2 |
1 |
0 |
1 |
0 |
0 |
2 |
0.00% |
|
3929.3 |
0 |
0 |
1 |
34 |
53 |
88 |
0.05% |
|
Pike |
77 |
82 |
195 |
152 |
148 |
654 |
0.39% |
|
3929 |
77 |
82 |
195 |
152 |
148 |
654 |
0.39% |
|
Potter |
2 |
4 |
7 |
14 |
6 |
33 |
0.02% |
|
3929 |
2 |
4 |
7 |
14 |
6 |
33 |
0.02% |
|
Schuylkill |
288 |
179 |
221 |
263 |
276 |
1,227 |
0.73% |
|
3929 |
288 |
179 |
220 |
263 |
274 |
1,224 |
0.73% |
|
3929.3 |
0 |
0 |
1 |
0 |
2 |
3 |
0.00% |
|
Snyder |
93 |
251 |
125 |
84 |
53 |
606 |
0.36% |
|
3929 |
93 |
251 |
125 |
83 |
53 |
605 |
0.36% |
|
3929.3 |
0 |
0 |
0 |
1 |
0 |
1 |
0.00% |
|
Somerset |
121 |
90 |
104 |
107 |
73 |
495 |
0.29% |
|
3929 |
120 |
90 |
104 |
107 |
73 |
494 |
0.29% |
|
3929.3 |
1 |
0 |
0 |
0 |
0 |
1 |
0.00% |
|
Sullivan |
0 |
4 |
3 |
0 |
2 |
9 |
0.01% |
|
3929 |
0 |
4 |
3 |
0 |
2 |
9 |
0.01% |
|
Susquehanna |
16 |
6 |
5 |
19 |
14 |
60 |
0.04% |
|
3929 |
16 |
6 |
5 |
19 |
14 |
60 |
0.04% |
|
Tioga |
48 |
29 |
38 |
73 |
59 |
247 |
0.15% |
|
3929 |
48 |
29 |
38 |
73 |
59 |
247 |
0.15% |
|
Union |
47 |
98 |
54 |
94 |
136 |
429 |
0.25% |
|
3929 |
47 |
98 |
54 |
94 |
136 |
429 |
0.25% |
|
Venango |
72 |
43 |
72 |
131 |
95 |
413 |
0.25% |
|
3929 |
72 |
43 |
72 |
131 |
95 |
413 |
0.25% |
|
Warren |
124 |
230 |
232 |
128 |
165 |
879 |
0.52% |
|
3929 |
124 |
230 |
232 |
128 |
165 |
879 |
0.52% |
|
Washington |
389 |
318 |
399 |
568 |
522 |
2,196 |
1.30% |
|
3929 |
389 |
318 |
399 |
568 |
522 |
2,196 |
1.30% |
|
Wayne |
84 |
112 |
117 |
78 |
152 |
543 |
0.32% |
|
3929 |
84 |
112 |
117 |
78 |
152 |
543 |
0.32% |
|
Westmoreland |
809 |
753 |
1,016 |
968 |
1,225 |
4,771 |
2.83% |
|
3929 |
809 |
753 |
1,014 |
968 |
1,224 |
4,768 |
2.83% |
|
3929.2 |
0 |
0 |
1 |
0 |
0 |
1 |
0.00% |
|
3929.3 |
0 |
0 |
1 |
0 |
1 |
2 |
0.00% |
|
Wyoming |
24 |
26 |
32 |
14 |
15 |
111 |
0.07% |
|
3929 |
24 |
26 |
32 |
14 |
15 |
111 |
0.07% |
|
York |
777 |
674 |
1,051 |
1,509 |
1,686 |
5,697 |
3.38% |
|
3929 |
775 |
674 |
1,049 |
1,509 |
1,671 |
5,678 |
3.37% |
|
3929.2 |
0 |
0 |
0 |
0 |
1 |
1 |
0.00% |
|
3929.3 |
2 |
0 |
2 |
0 |
14 |
18 |
0.01% |
|
Grand Total |
27,840 |
24,897 |
32,442 |
38,530 |
44,694 |
168,403 |
N/A |